
Acta Crystallographica Section B
Acta Crystallographica
Section B STRUCTURAL SCIENCE, CRYSTAL ENGINEERING AND MATERIALS
Acta Crystallographica
Section B STRUCTURAL SCIENCE, CRYSTAL ENGINEERING AND MATERIALS


 menu
|
|
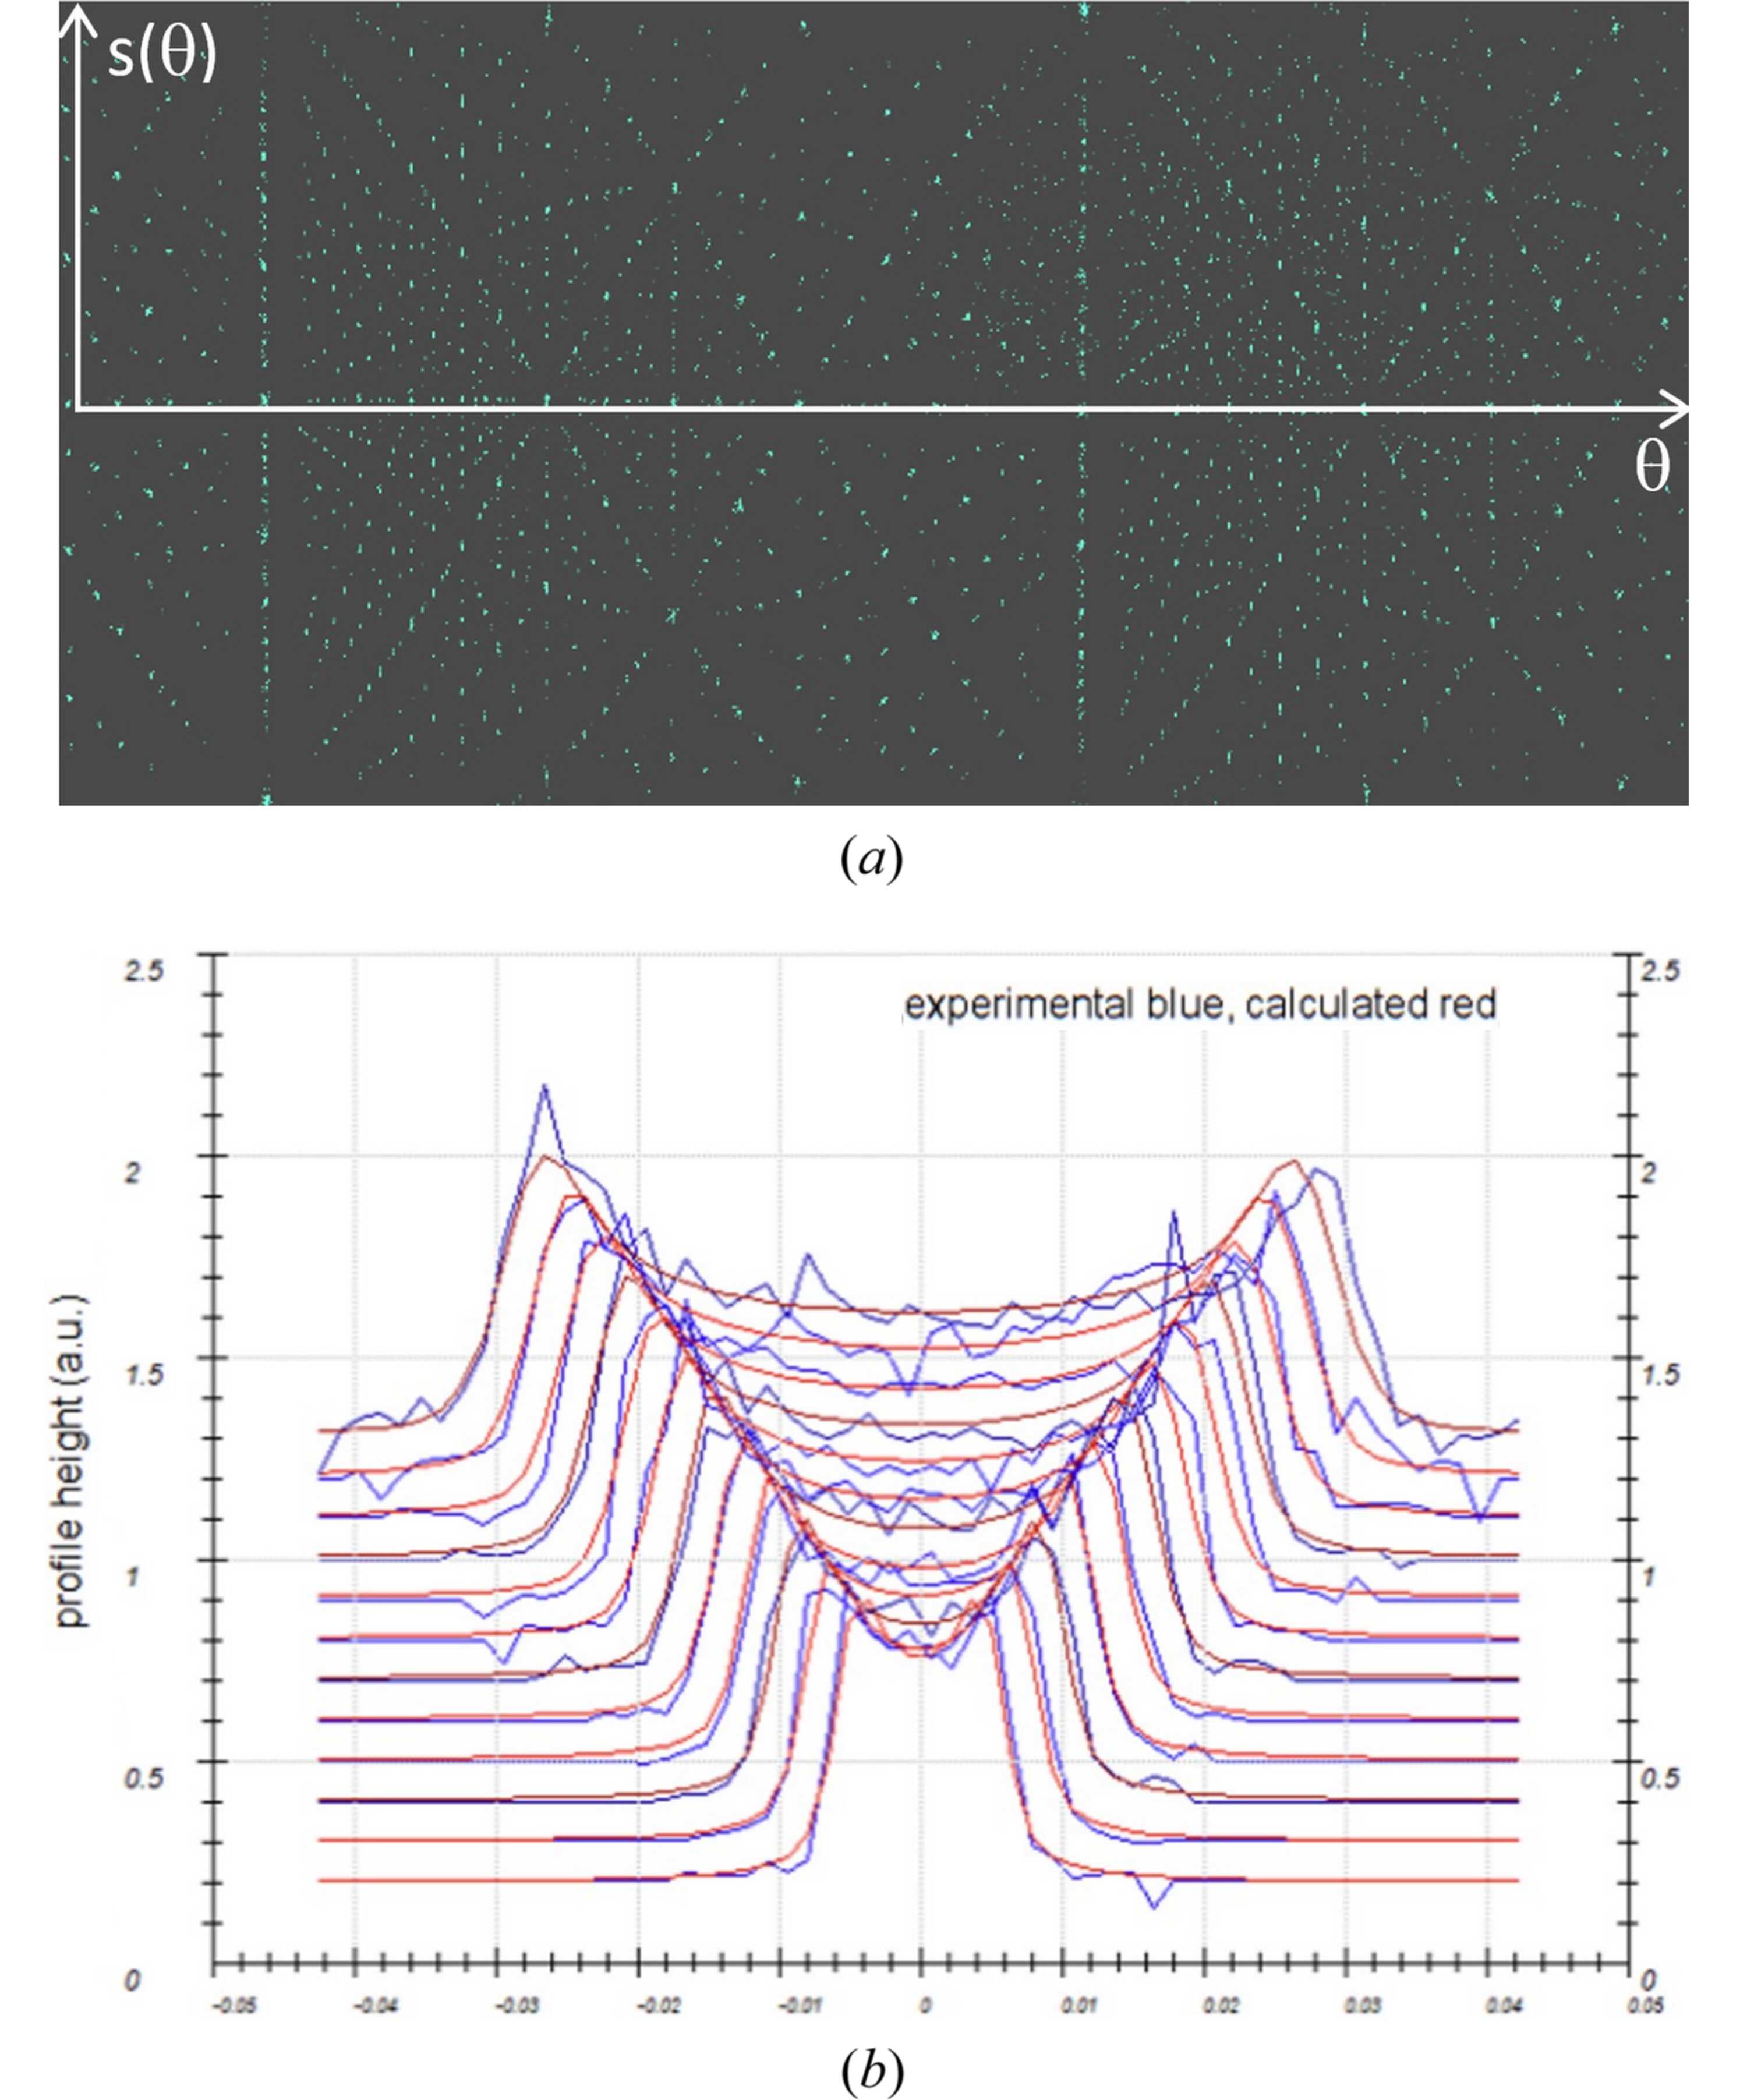
Figure 2
(a) Sinogram representing s(θ) (reflection position) versus θ (rotation angle) and (b) the camel plot after PETS2 processing. |
| STRUCTURAL SCIENCE CRYSTAL ENGINEERING MATERIALS |
ISSN: 2052-5206
 access