
Acta Crystallographica Section B
Acta Crystallographica
Section B STRUCTURAL SCIENCE, CRYSTAL ENGINEERING AND MATERIALS
Acta Crystallographica
Section B STRUCTURAL SCIENCE, CRYSTAL ENGINEERING AND MATERIALS


 menu
|
|
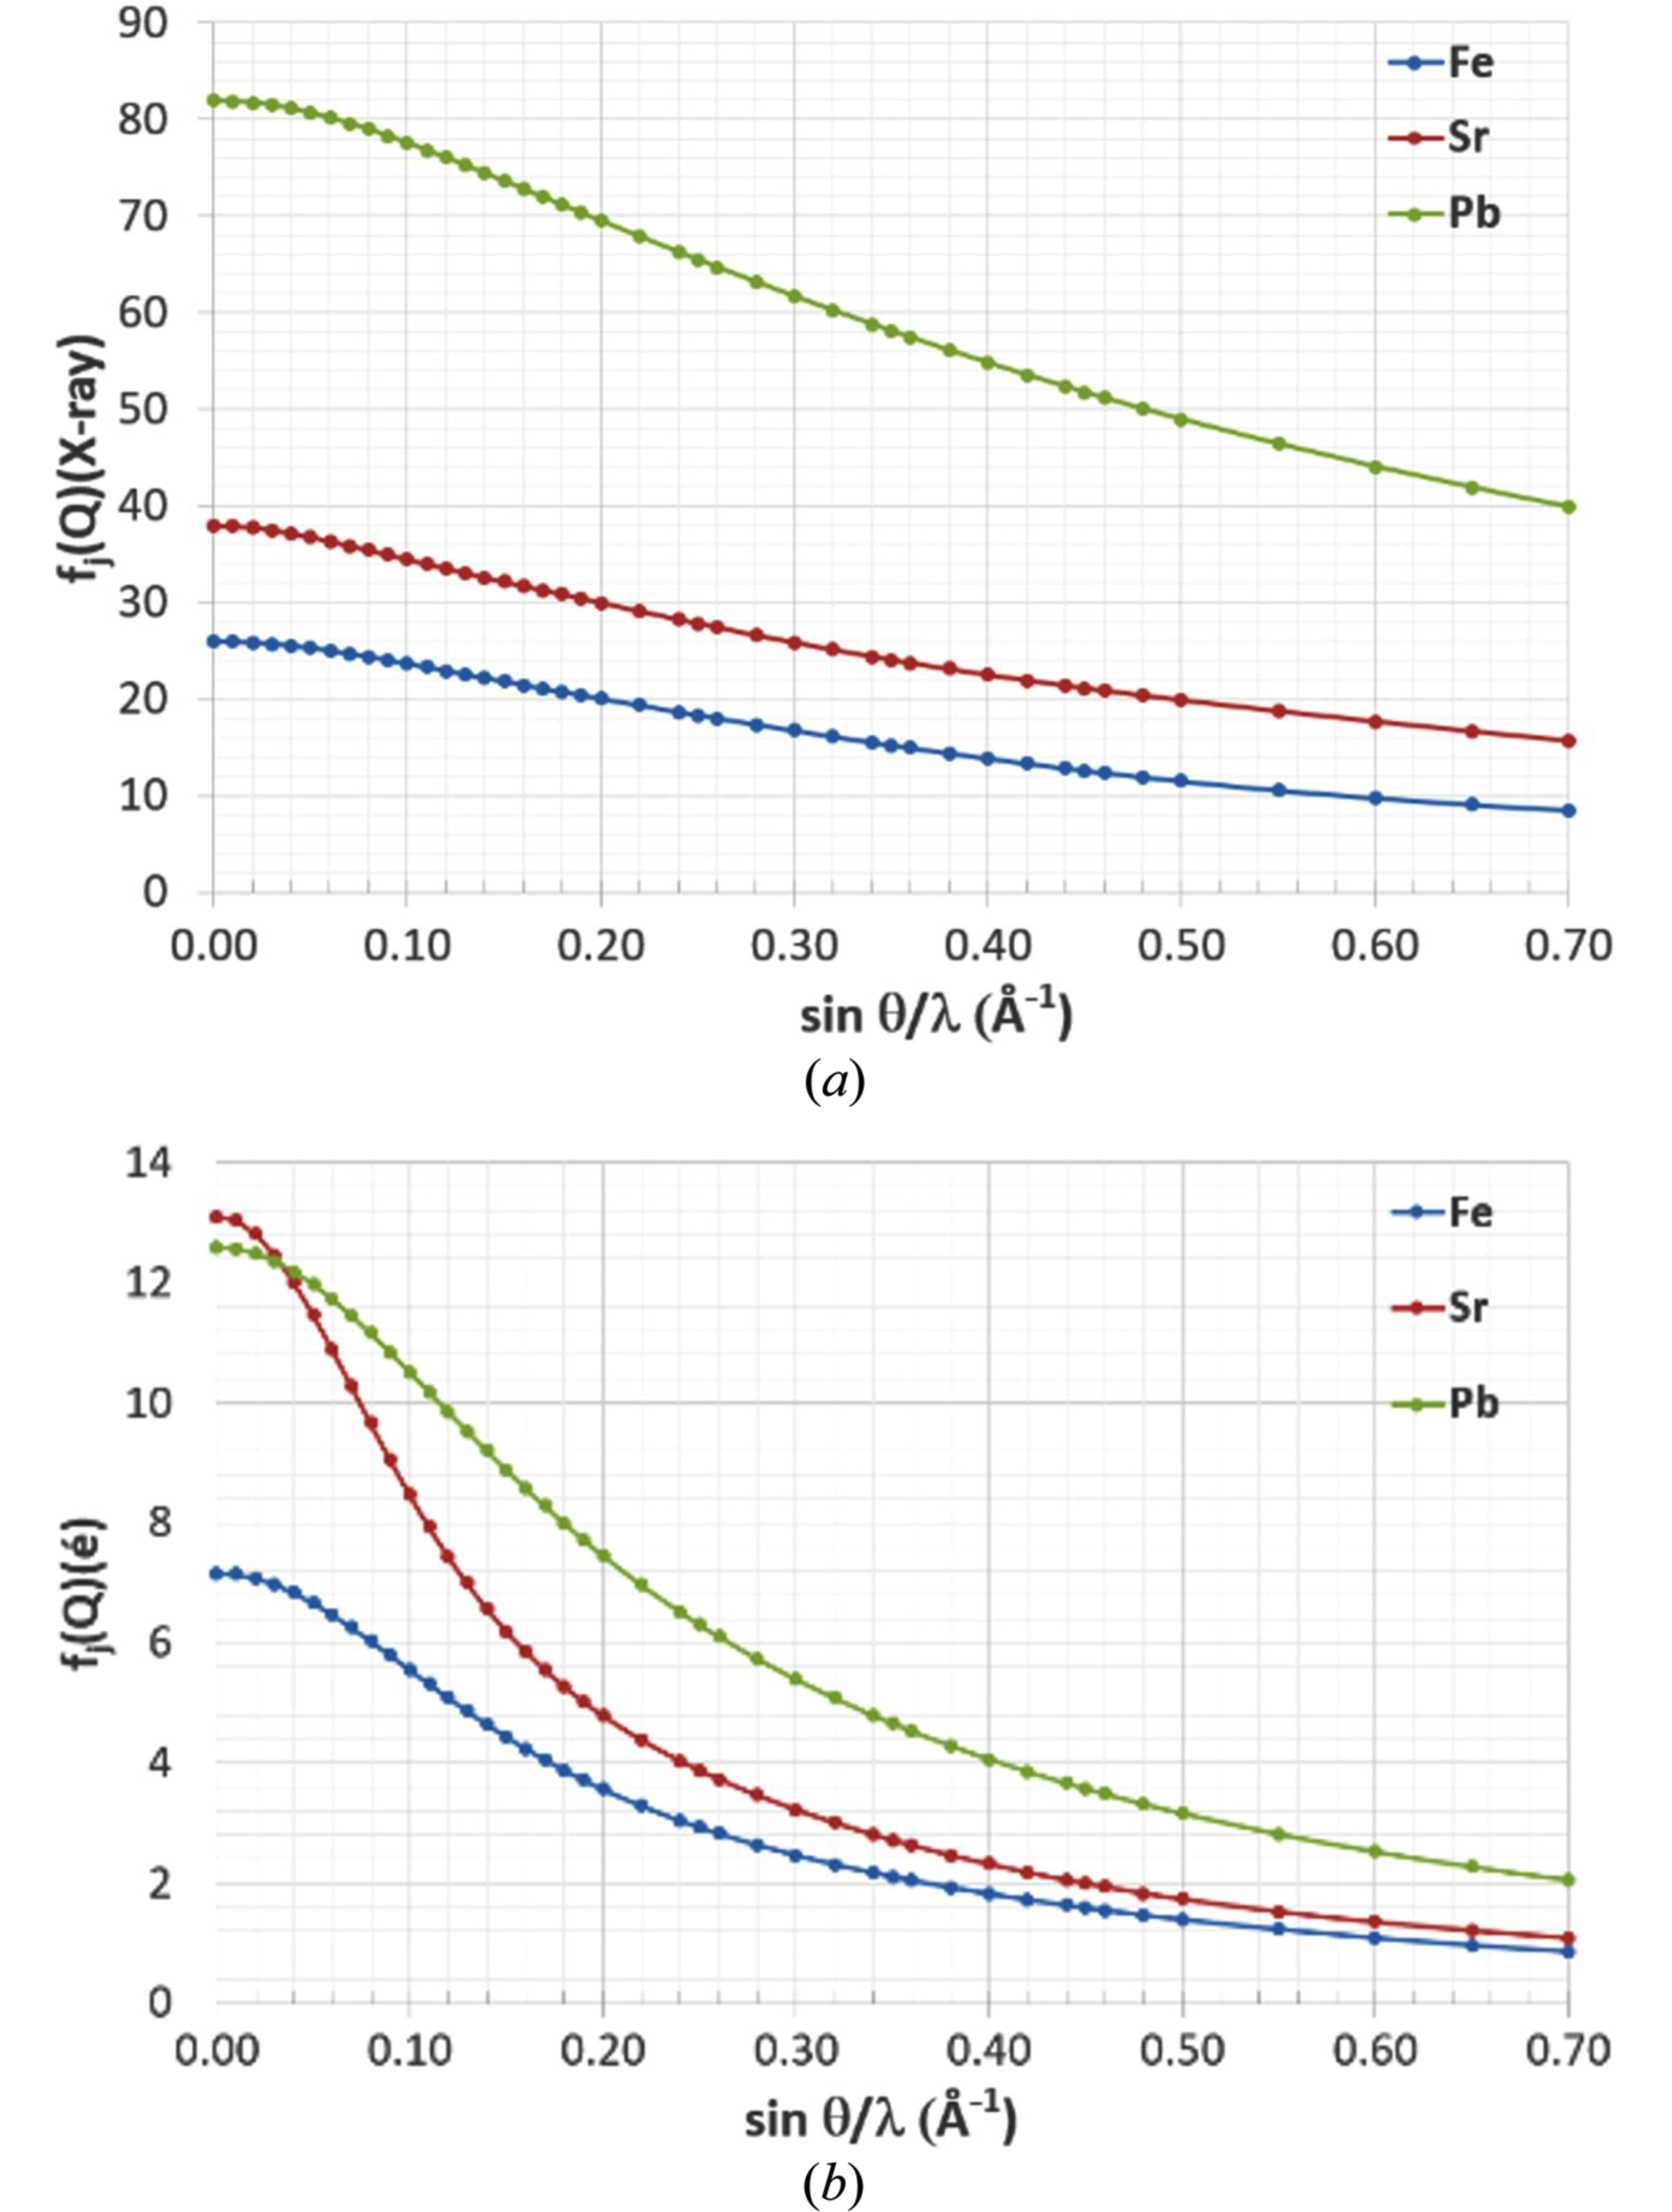
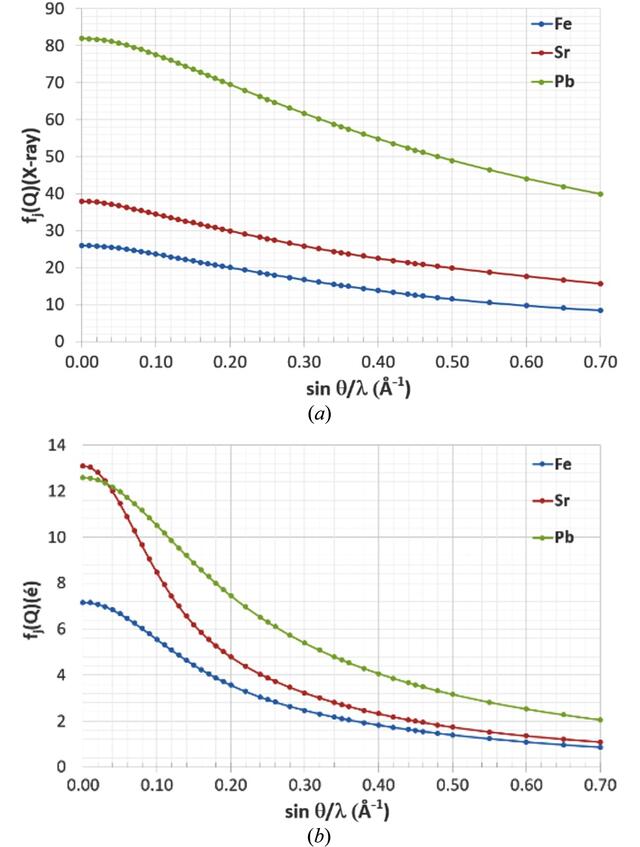
Figure 5
(a) X-ray and (b) electron scattering factor curves of Fe, Sr and Pb atoms plotted using values from Doyle & Turner (1968  ). |
| STRUCTURAL SCIENCE CRYSTAL ENGINEERING MATERIALS |
ISSN: 2052-5206
 access