
Acta Crystallographica Section B
Acta Crystallographica
Section B STRUCTURAL SCIENCE, CRYSTAL ENGINEERING AND MATERIALS
Acta Crystallographica
Section B STRUCTURAL SCIENCE, CRYSTAL ENGINEERING AND MATERIALS


 menu
|
|
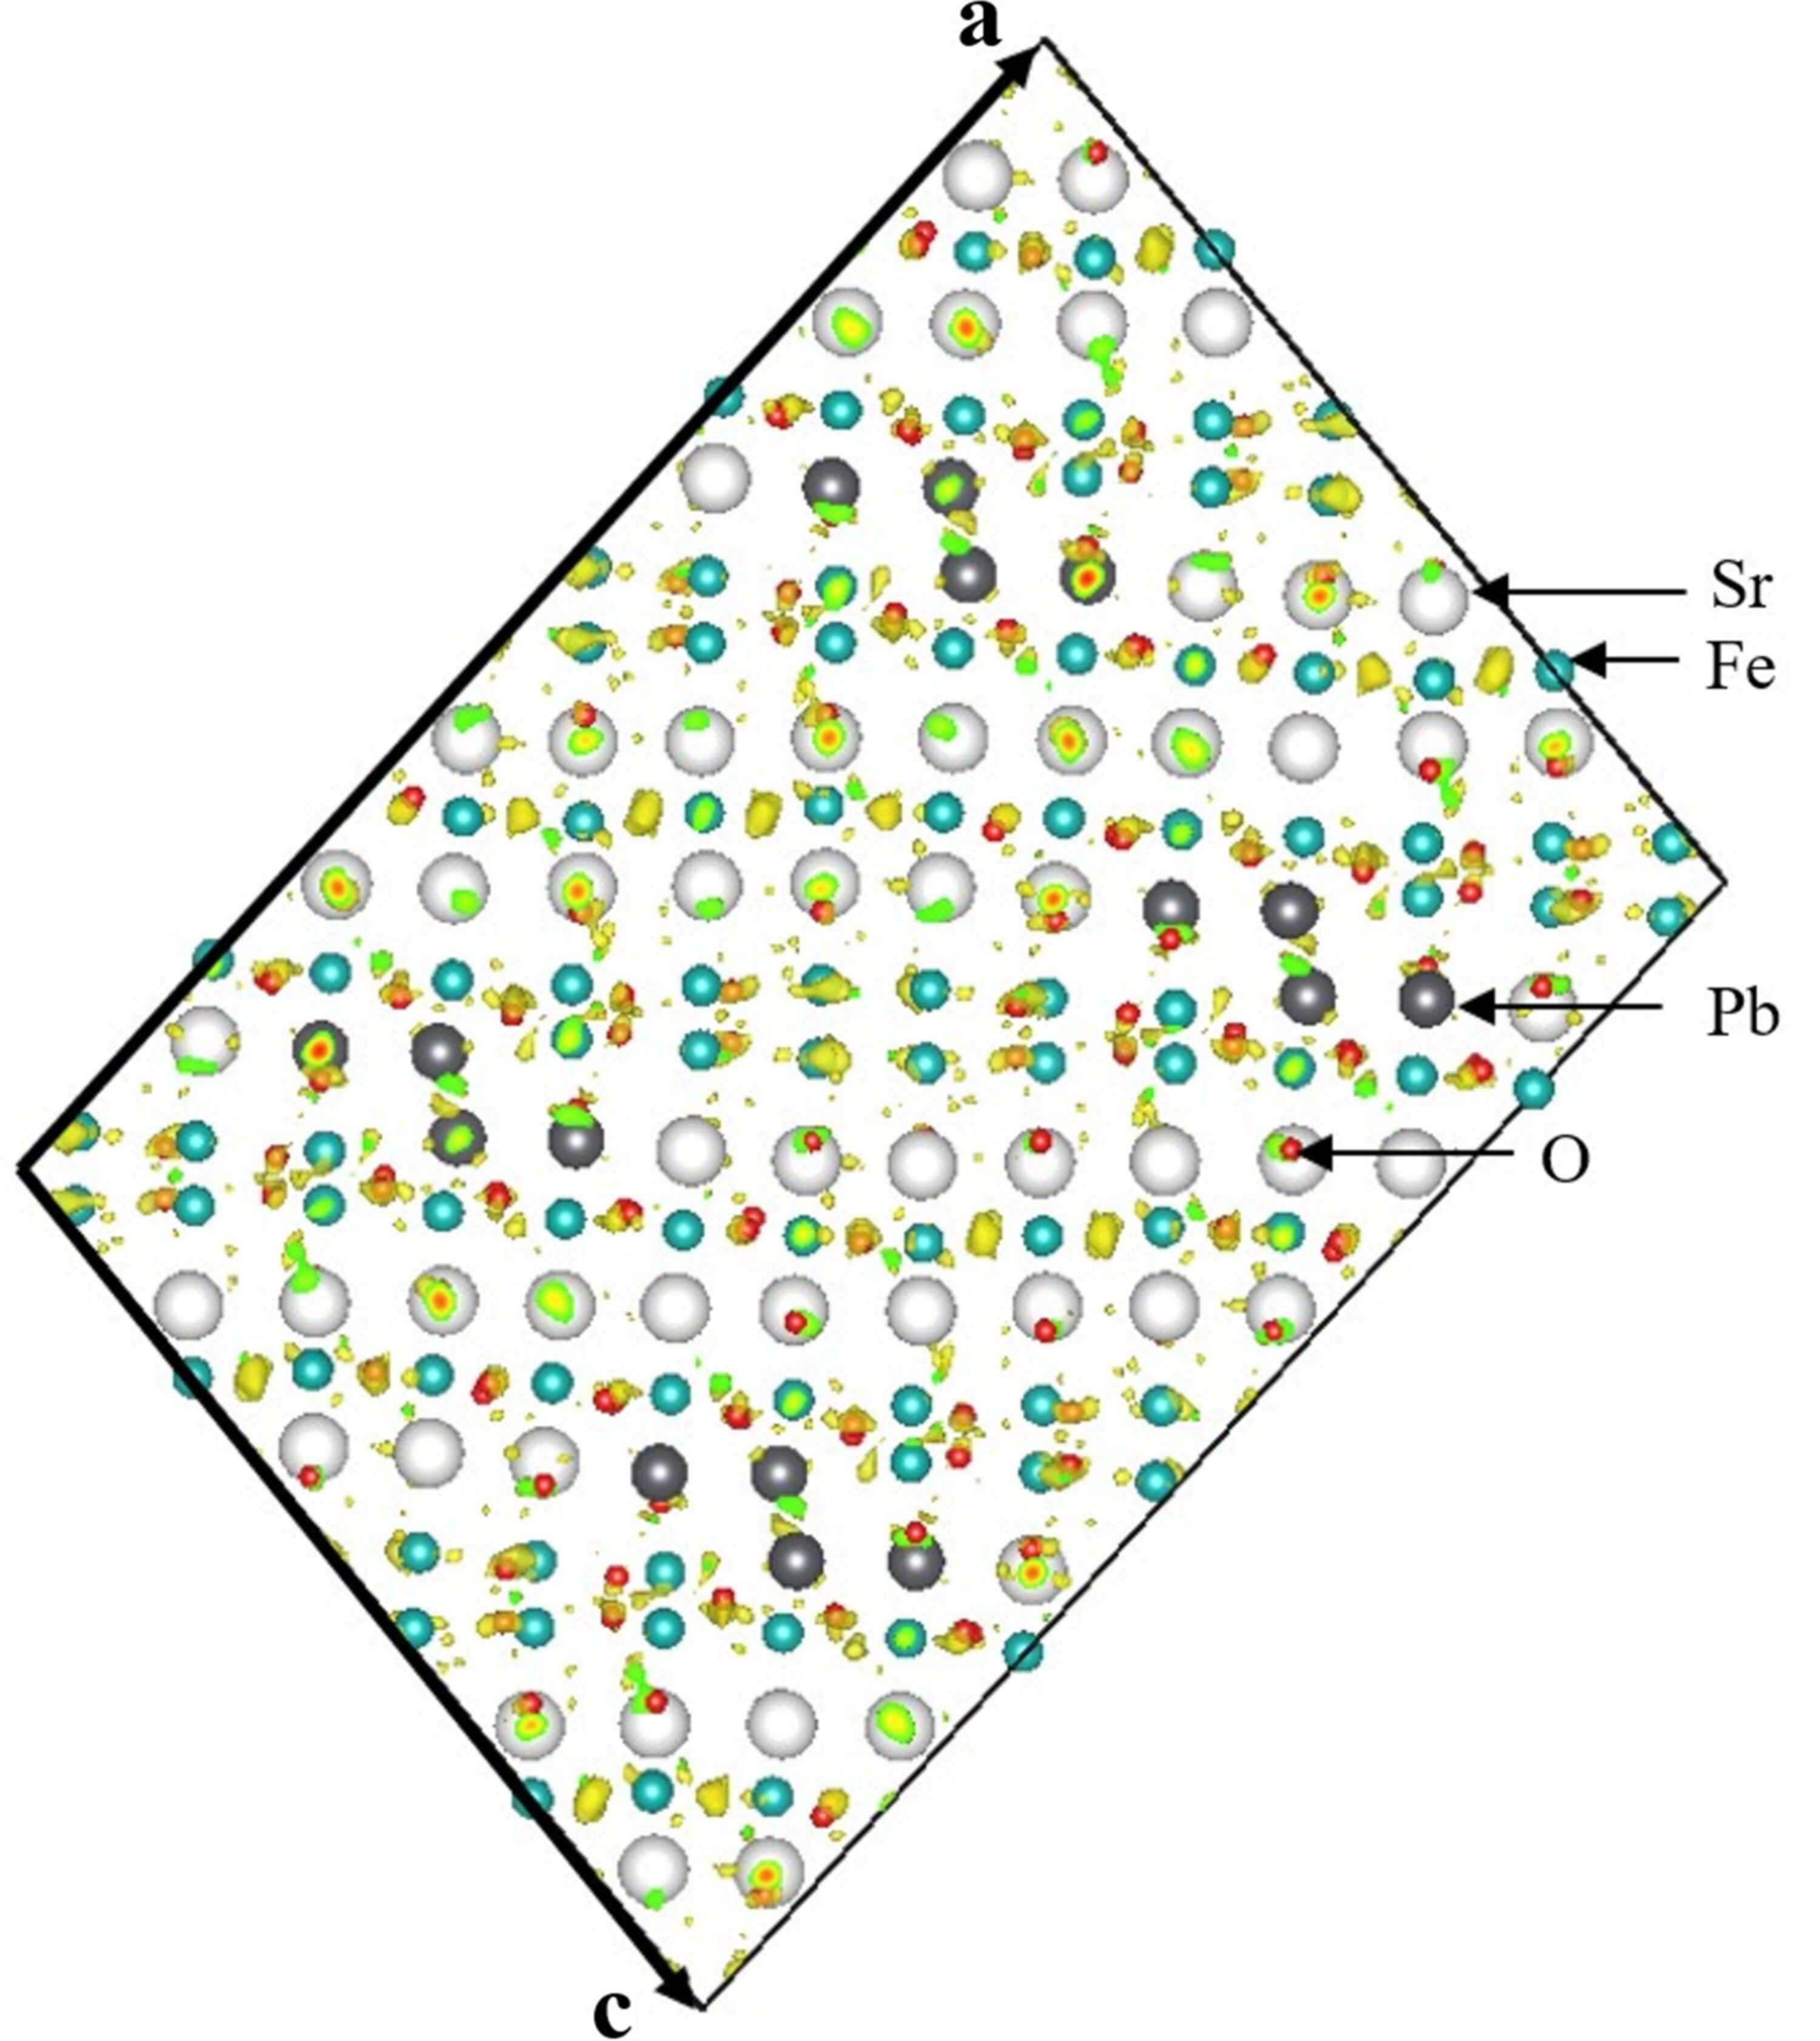
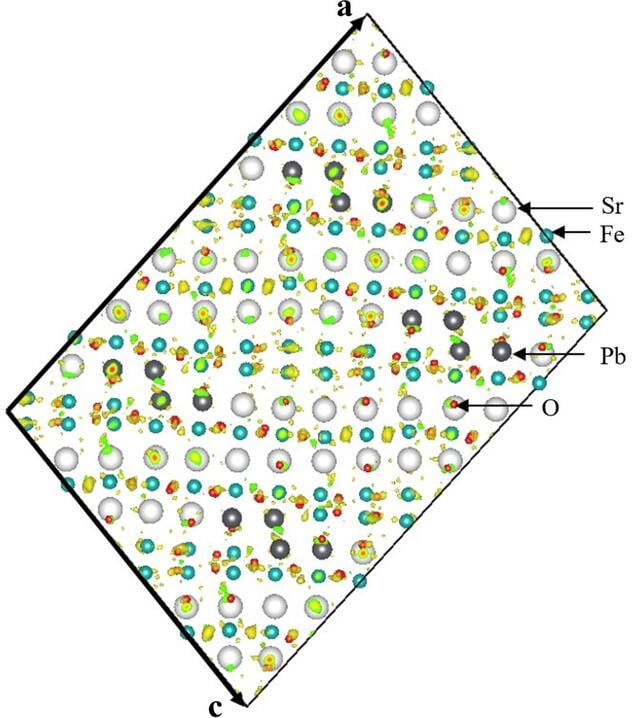
Figure 7
Difference FFT map created after kinematical refinement. Residual positive electrostatic potentials (yellow dots) reveal the positions of the last missing O atoms in the structure. |
| STRUCTURAL SCIENCE CRYSTAL ENGINEERING MATERIALS |
ISSN: 2052-5206
 access