 | Acta Crystallographica Section D Acta Crystallographica Section D BIOLOGICAL CRYSTALLOGRAPHY |


 journal menu
|
|
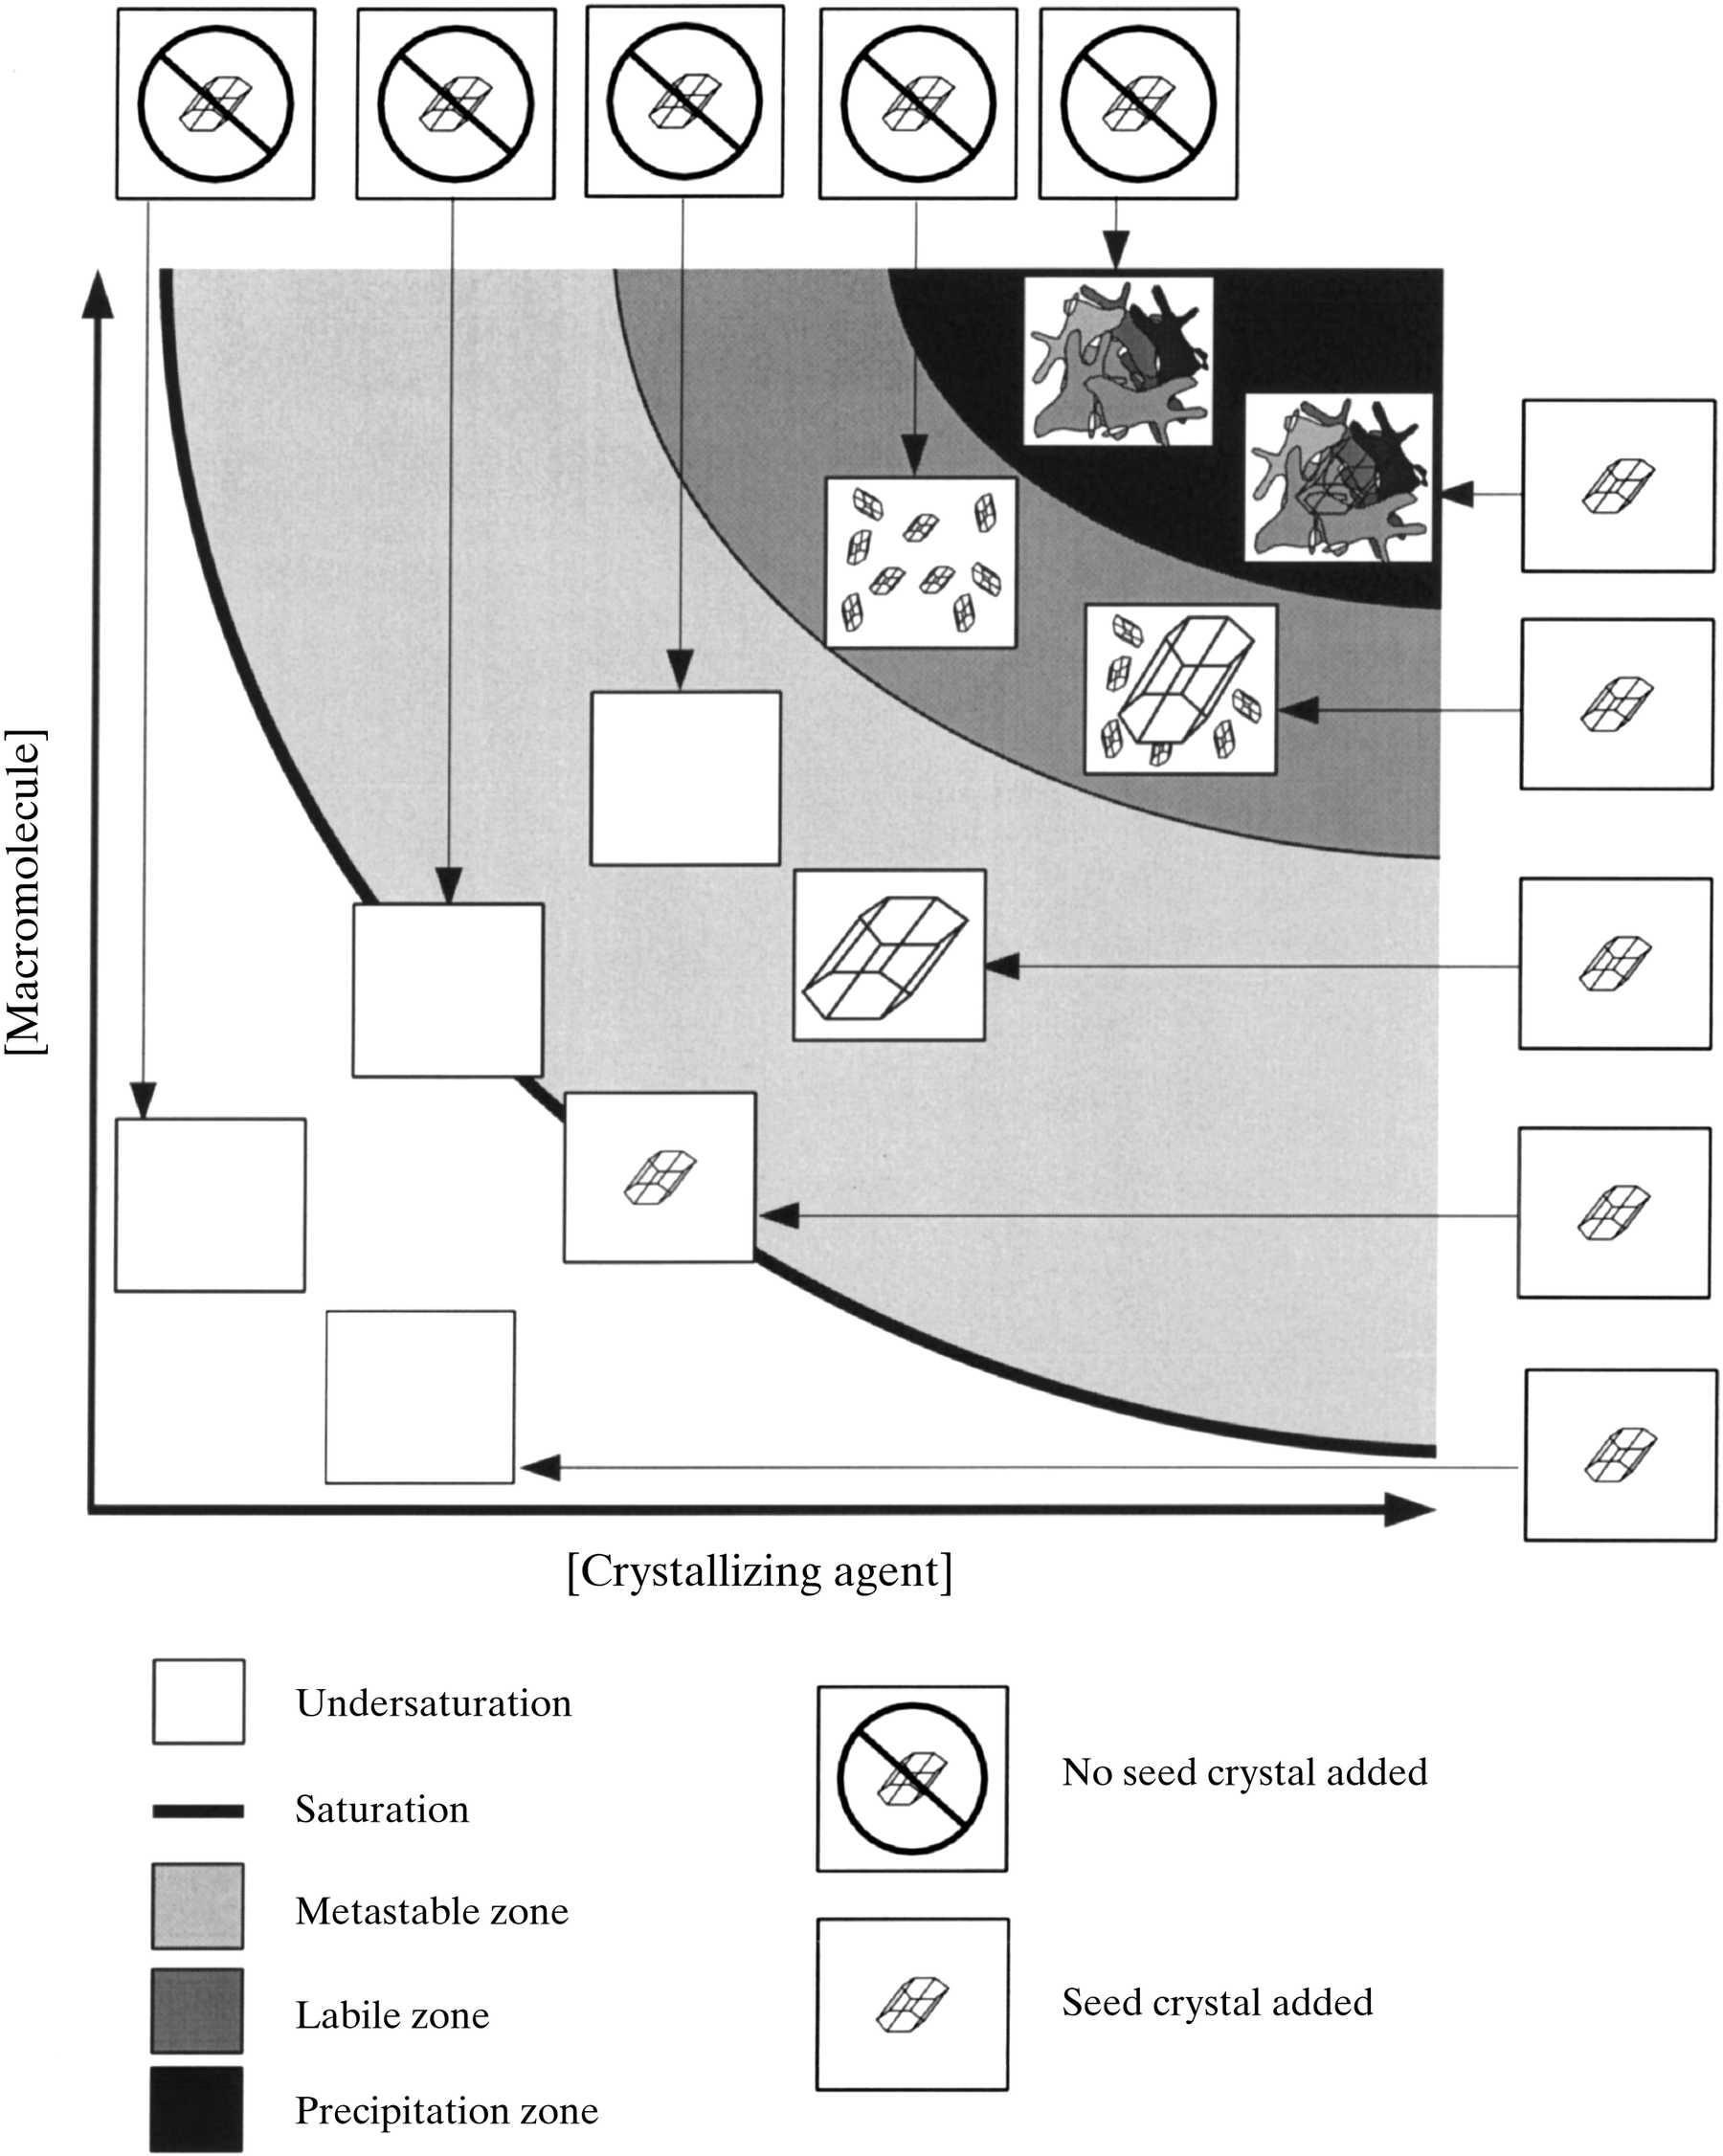
Figure 1
A two-dimensional representation of a crystallization experiment showing results with and without introduction of a macroseed. The graph is divided into three major zones: undersaturated, saturated and supersaturated. In the first region, represented by the area under the solubility curve, solution conditions are undersaturated with respect to the macromolecule, homogeneous spontaneous nucleation cannot occur and a crystal placed in the solution will dissolve. The next region, saturation, is measured experimentally and is represented by the two-dimensional solubility curve. Along the saturation curve, homogeneous spontaneous nucleation cannot occur and crystals added to the solution will not dissolve or increase in size. The next region of the graph, supersaturation, can be further divided into three sequential zones. The first zone, metastable supersaturation, is supersaturated to the point that spontaneous homogeneous nucleation does not occur in a reasonable length of time; however, crystals added to the solution will grow. The metastable zone is the region ideal for seeding a protein solution. The second region, labile supersaturation, represents a region where spontaneous homogeneous nucleation can occur and crystals added to the solution will grow. This region is not as well suited for seeding as the metastable region. Seed crystals added to a labile supersaturated solution can shock the solution and cause excessive nucleation. The final precipitation zone is an area which is many times supersaturated with respect to crystal growth and leads to the formation of amorphous precipitate. |
| BIOLOGICAL CRYSTALLOGRAPHY |
ISSN: 1399-0047


