

 menu
|
|
Figure 2
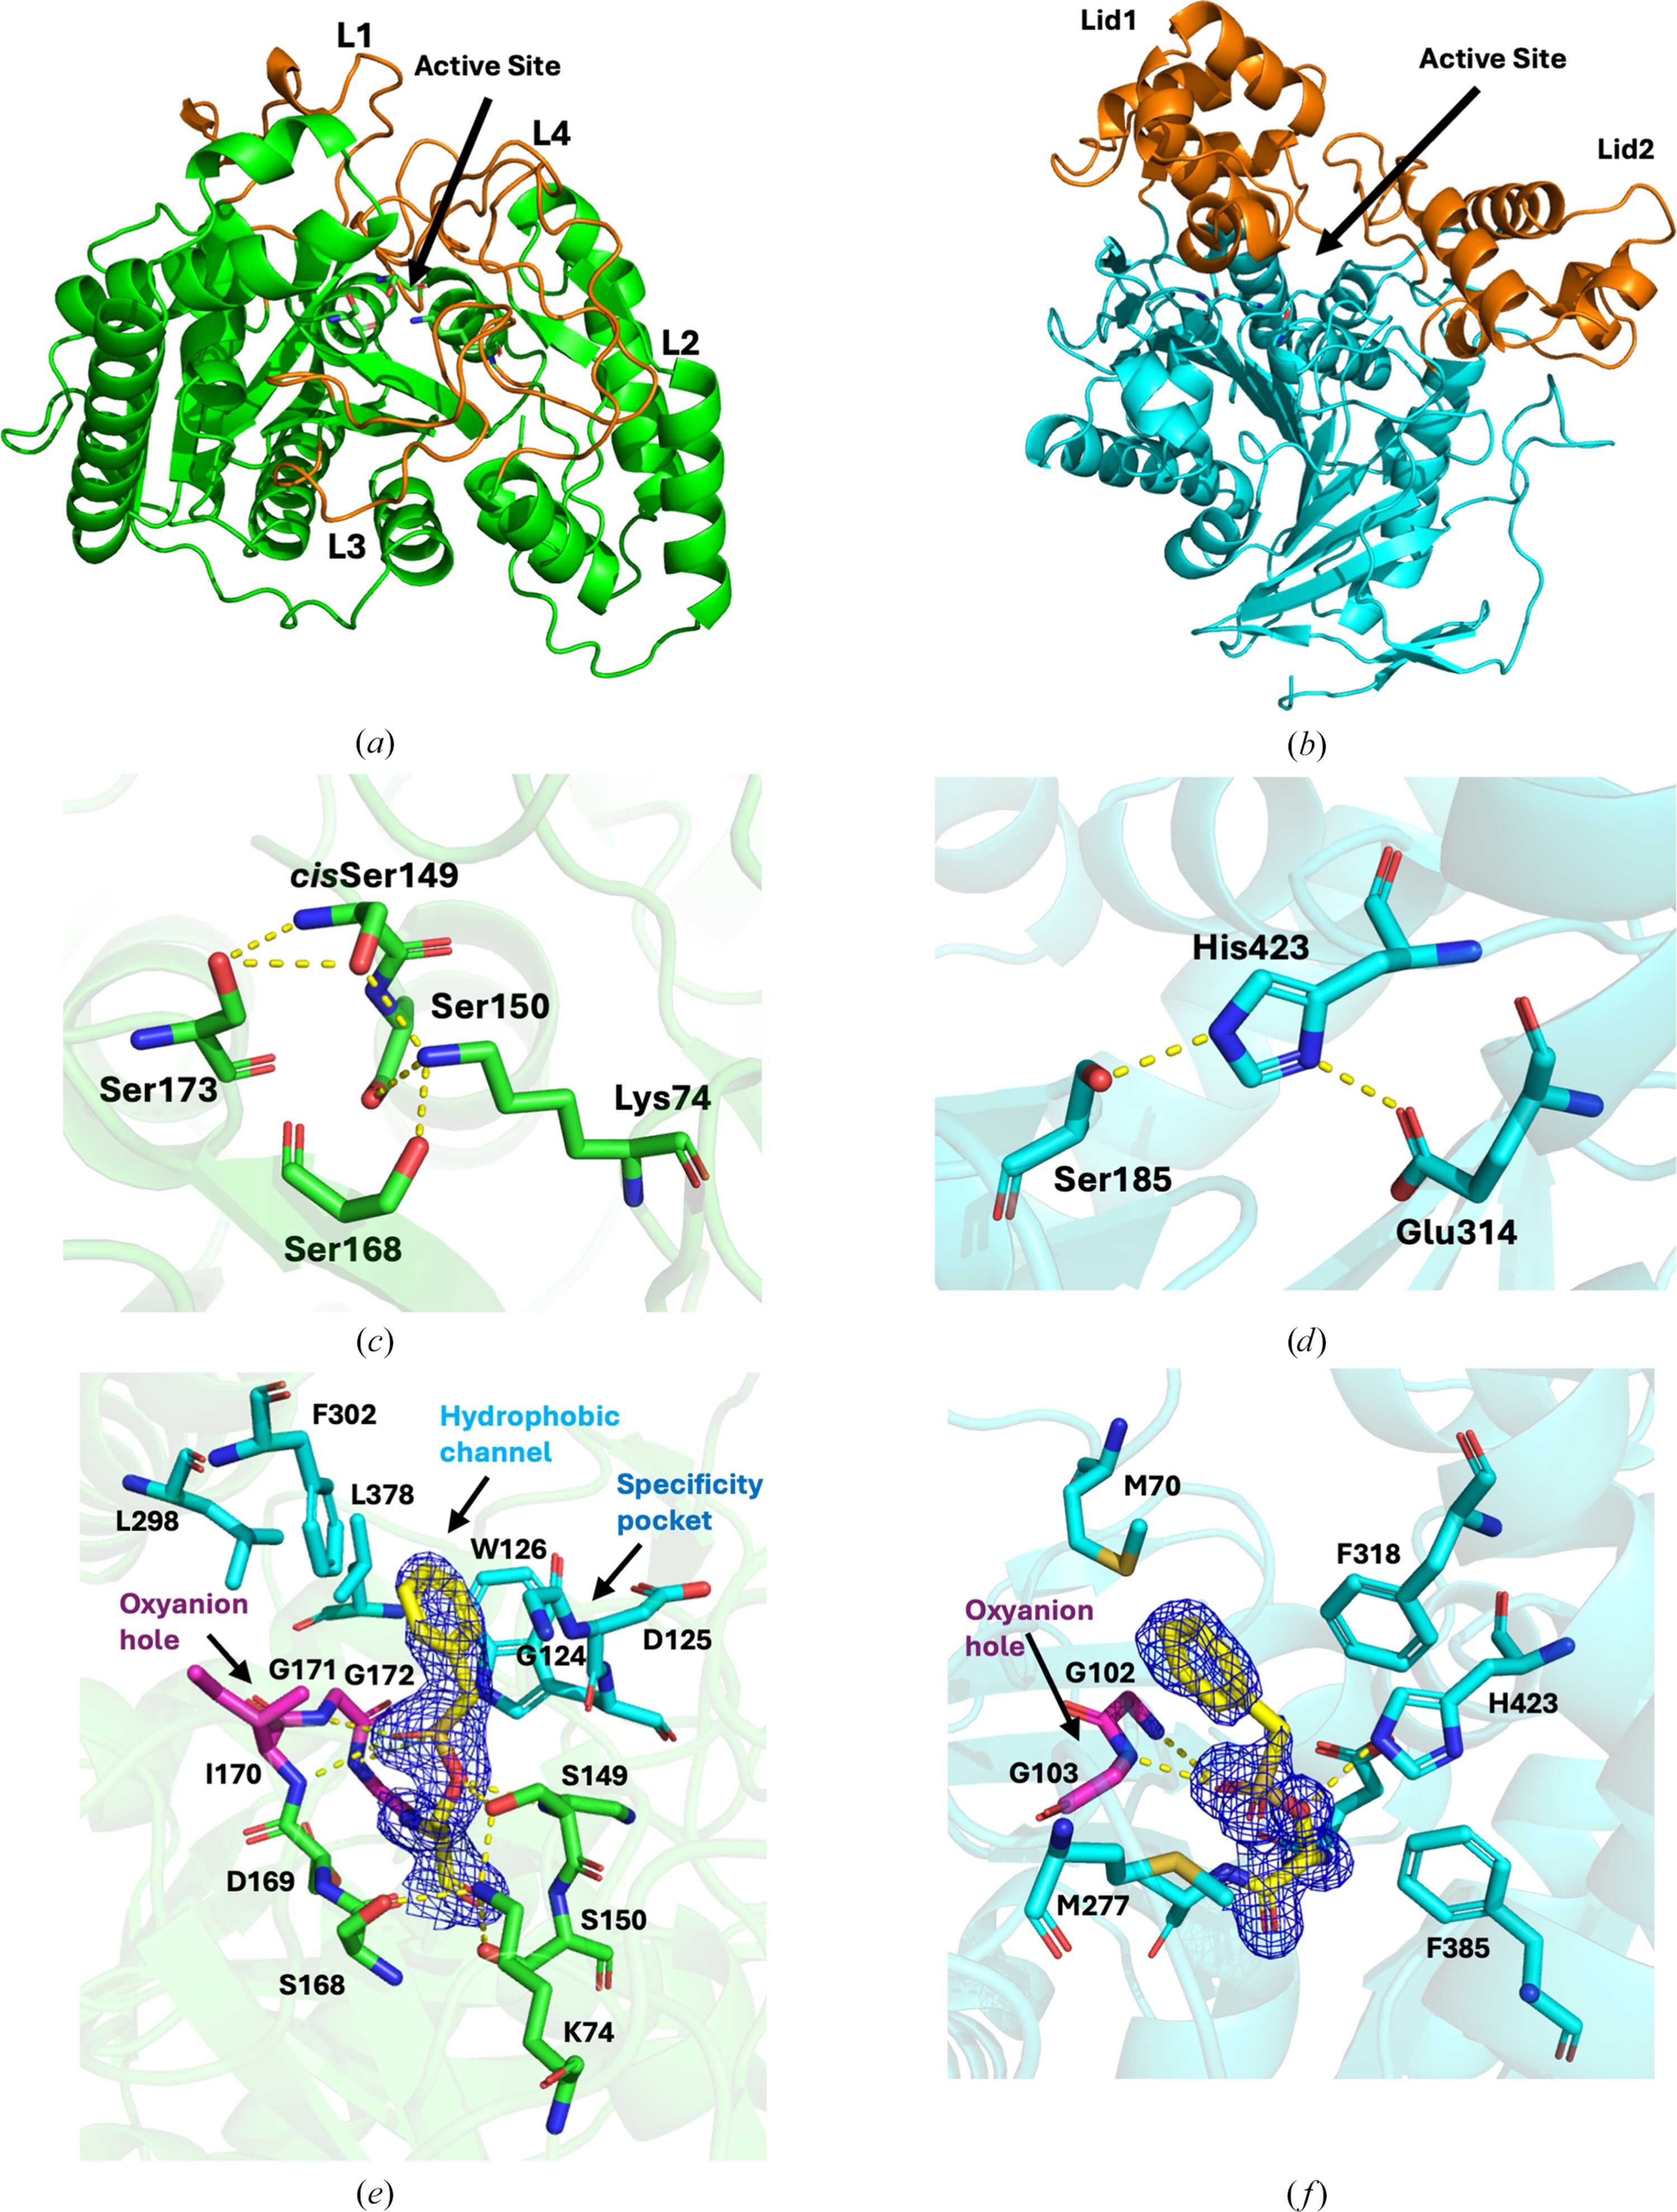
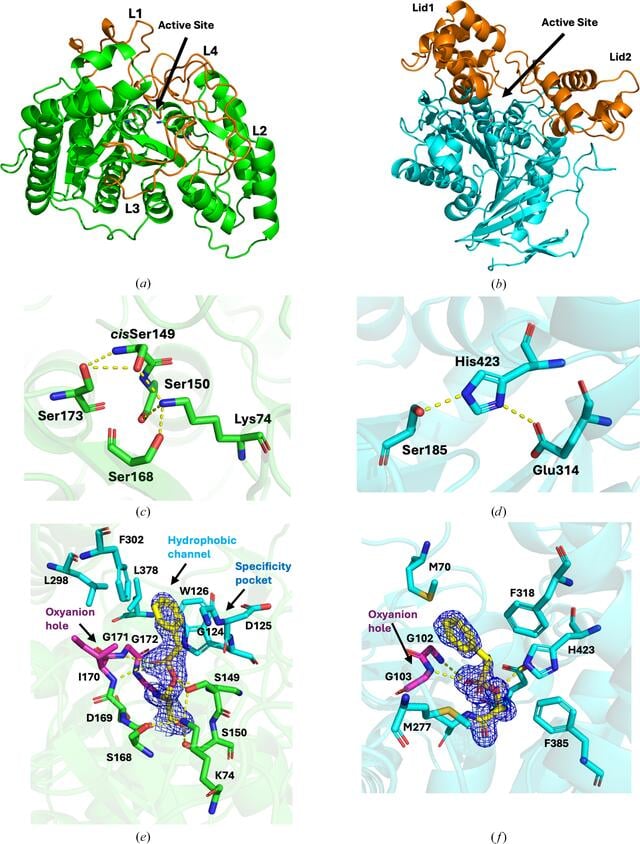
Structural overview of two different catalytic scaffolds for polyurethane degradation. (a) Overall structure of amidase U11 (PDB entry 30sd) with the catalytic triad depicted as sticks and L1–L4 shown in orange. (b) Overall structure of esterase AXPUR5 (PDB entry 29jv) shown with the catalytic triad residues as sticks and the Lid1 and Lid2 domains shown in orange. (c, d) The catalytic triad (Ser173, cisSer149 and Lys79) along with two conserved serine residues that maintain the hydrogen-bonding network of amidase U11 (c) and the catalytic triad of AXPUR5 (d). (e, f) Structures of the PMS-bound region in amidase U11 (PDB entry 30fo) (e) and esterase AXPUR5 (PDB entry 29jy) (f) with surrounding residues shown as sticks. The 2mFo − DFc standard map at a 1.5σ contour level for PMS is depicted as a blue mesh. |
 | STRUCTURAL BIOLOGY |
ISSN: 2059-7983
Open  access