

 menu
|
|
Figure 4
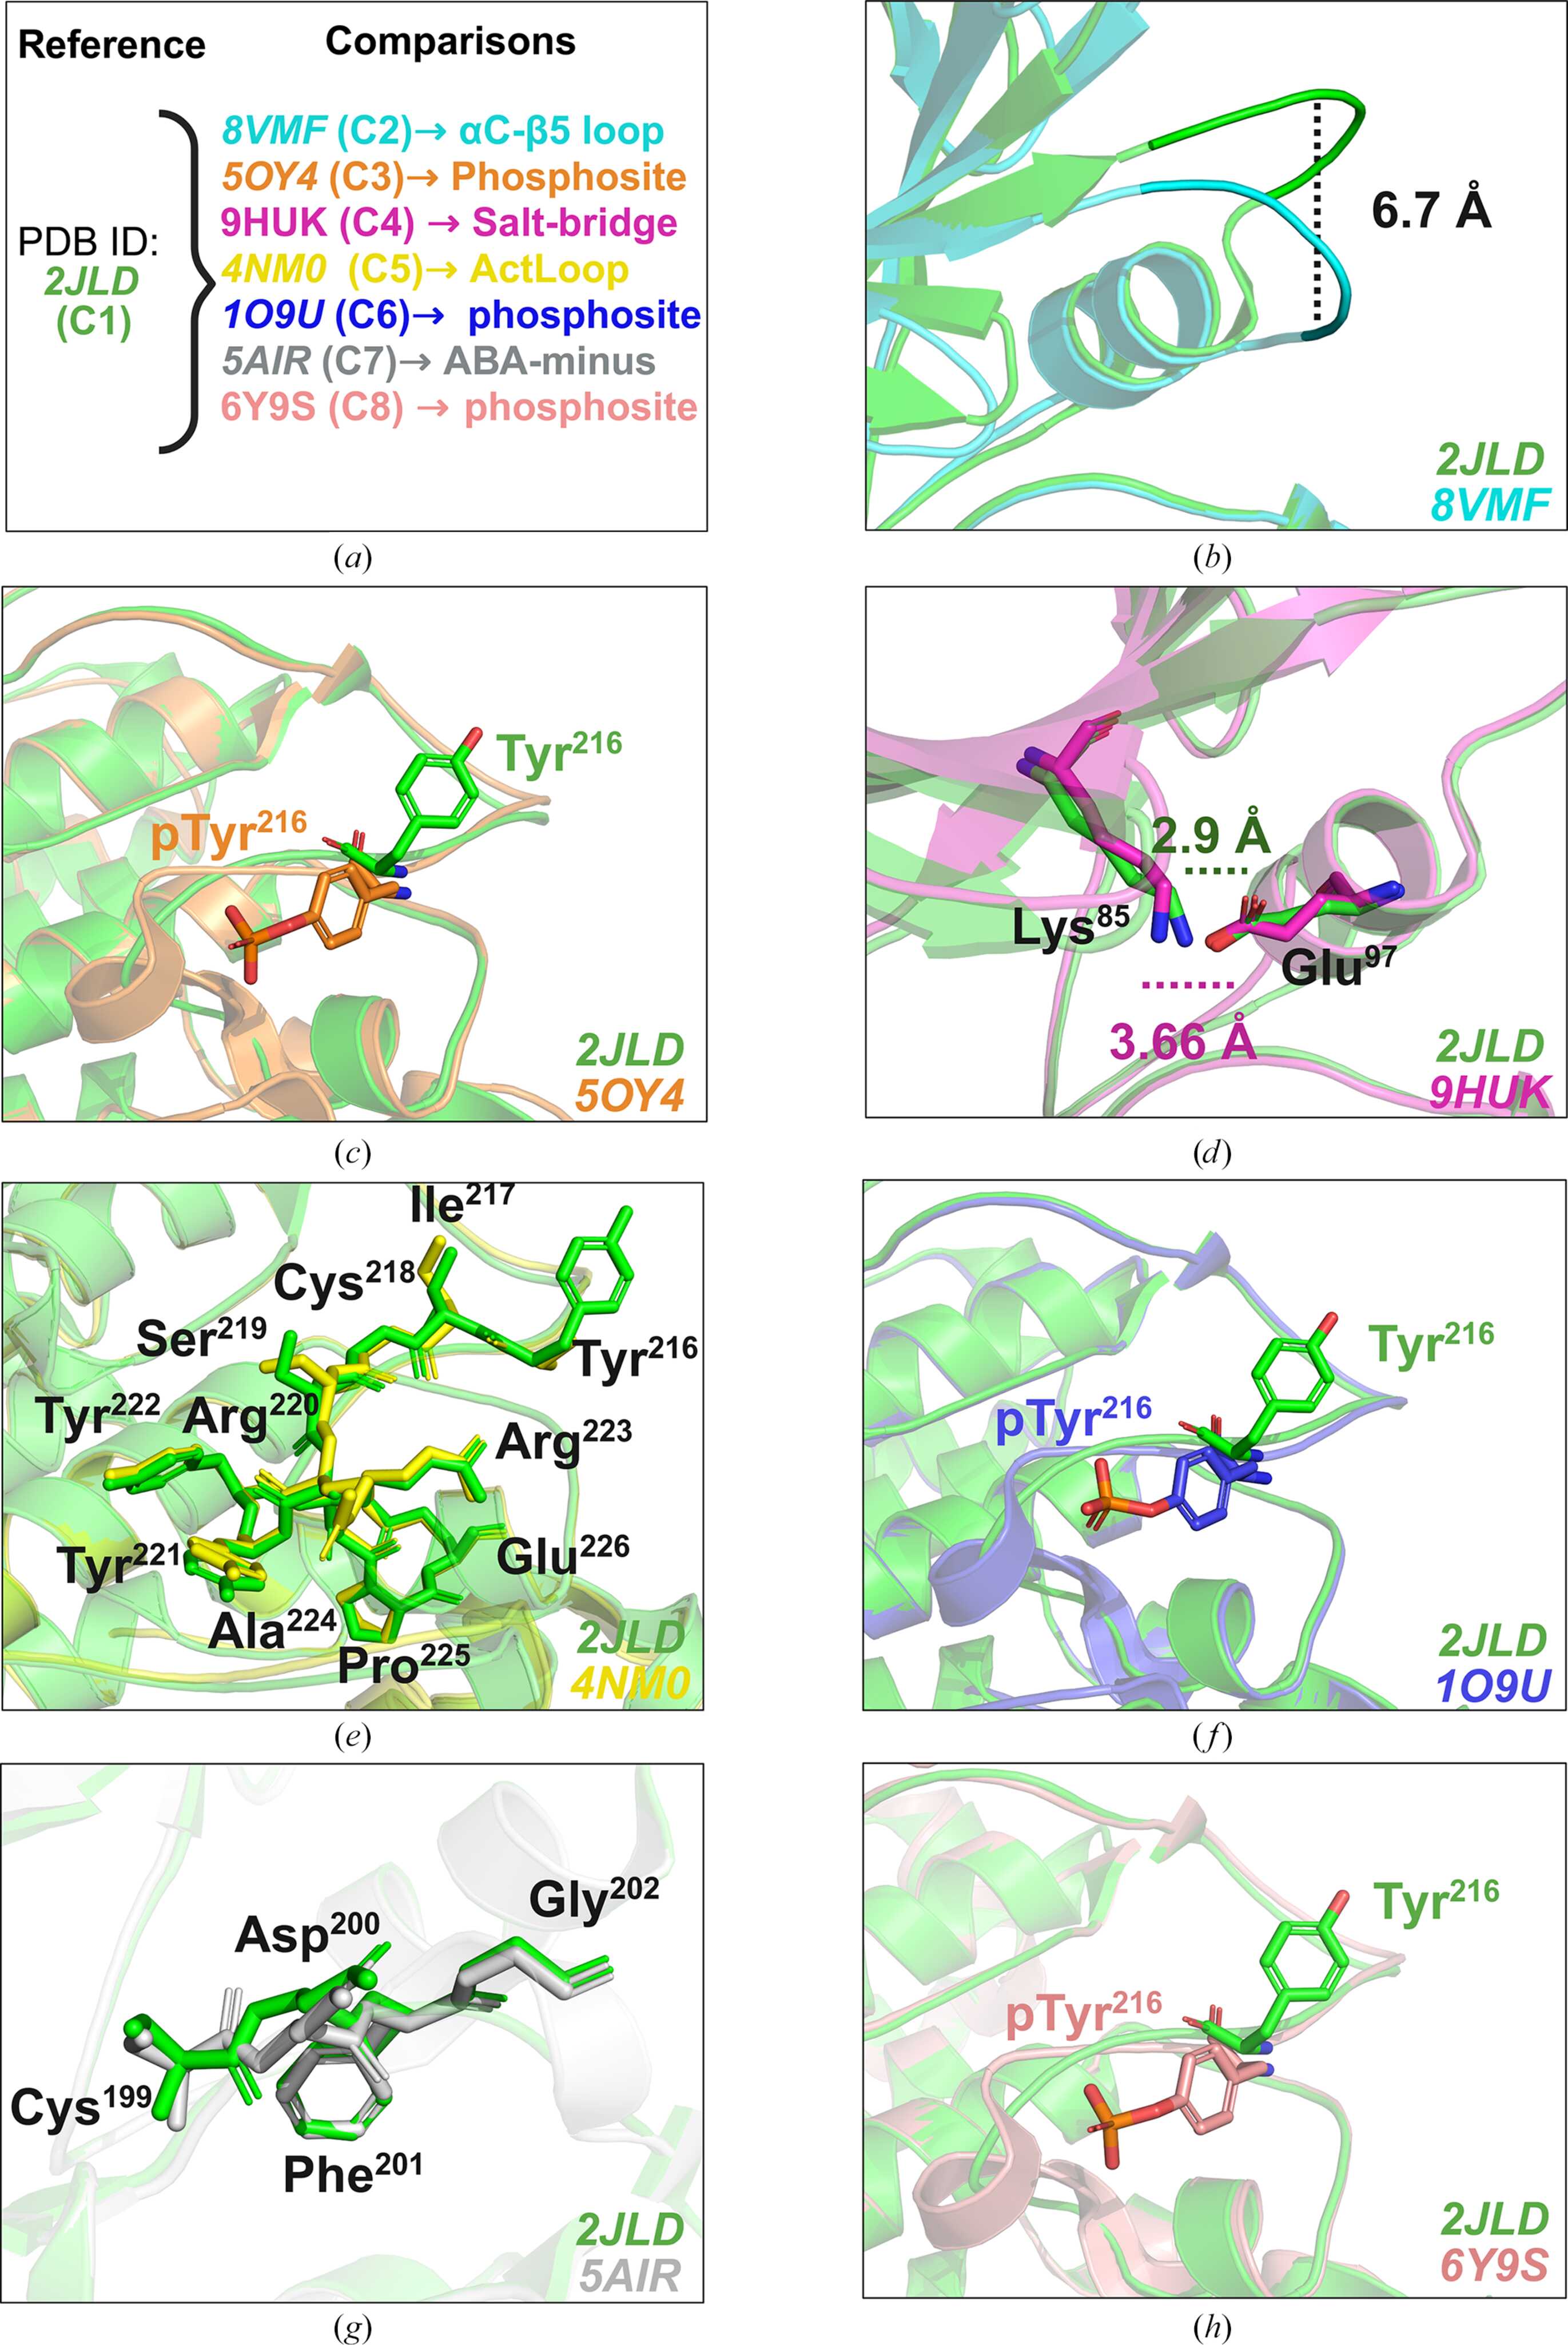
Structural basis of the conformational diversity of GSK3β. (a) Overview of the eight GSK3β conformations and the structural features assessed relative to Conformation 1 (reference; representative PDB entry 2jld). Each conformation is represented by a corresponding PDB structure. (b) Comparison of the αC–β5-loop configurations. Conformation 1 adopts a αC–β5 loop-in configuration, whereas Conformation 2 (representative PDB entry 8vmf) adopts a αC–β5 loop-out configuration, with a centroid displacement of 6.7 Å relative to Conformation 1. (c) Comparison of phosphorylated Tyr216 in Conformation 3 (representative PDB entry 5oy4) with unphosphorylated Tyr216 in Conformation 1. (d) Comparison of the intact and displaced Lys85–Glu97 salt-bridge configurations represented by Conformation 1 and Conformation 4 (representative PDB entry 9huk), respectively. The Lys85–Glu97 distance is 2.9 Å in Conformation 1 and 3.66 Å in Conformation 4. (e) Comparison of C-terminal activation-loop conformations. Conformation 1 adopts the ActLoop-in configuration, whereas Conformation 5 (representative PDB entry 4nm0) adopts the ActLoop-out configuration. (f) Comparison of phosphorylated Tyr216 in Conformation 6 (representative PDB entry 1o9u) with unphosphorylated Tyr216 in Conformation 1. (g) Comparison of the DFG-motif dihedral labels. Conformation 1 is assigned the BLA-minus label whereas Conformation 7 (representative PDB entry 5air) is assigned the ABA-minus label. (h) Comparison of phosphorylated Tyr216 in Conformation 8 (representative PDB entry 6y9s) with unphosphorylated Tyr216 in Conformation 1. |
 | STRUCTURAL BIOLOGY |
ISSN: 2059-7983
Open  access