

 menu
|
|
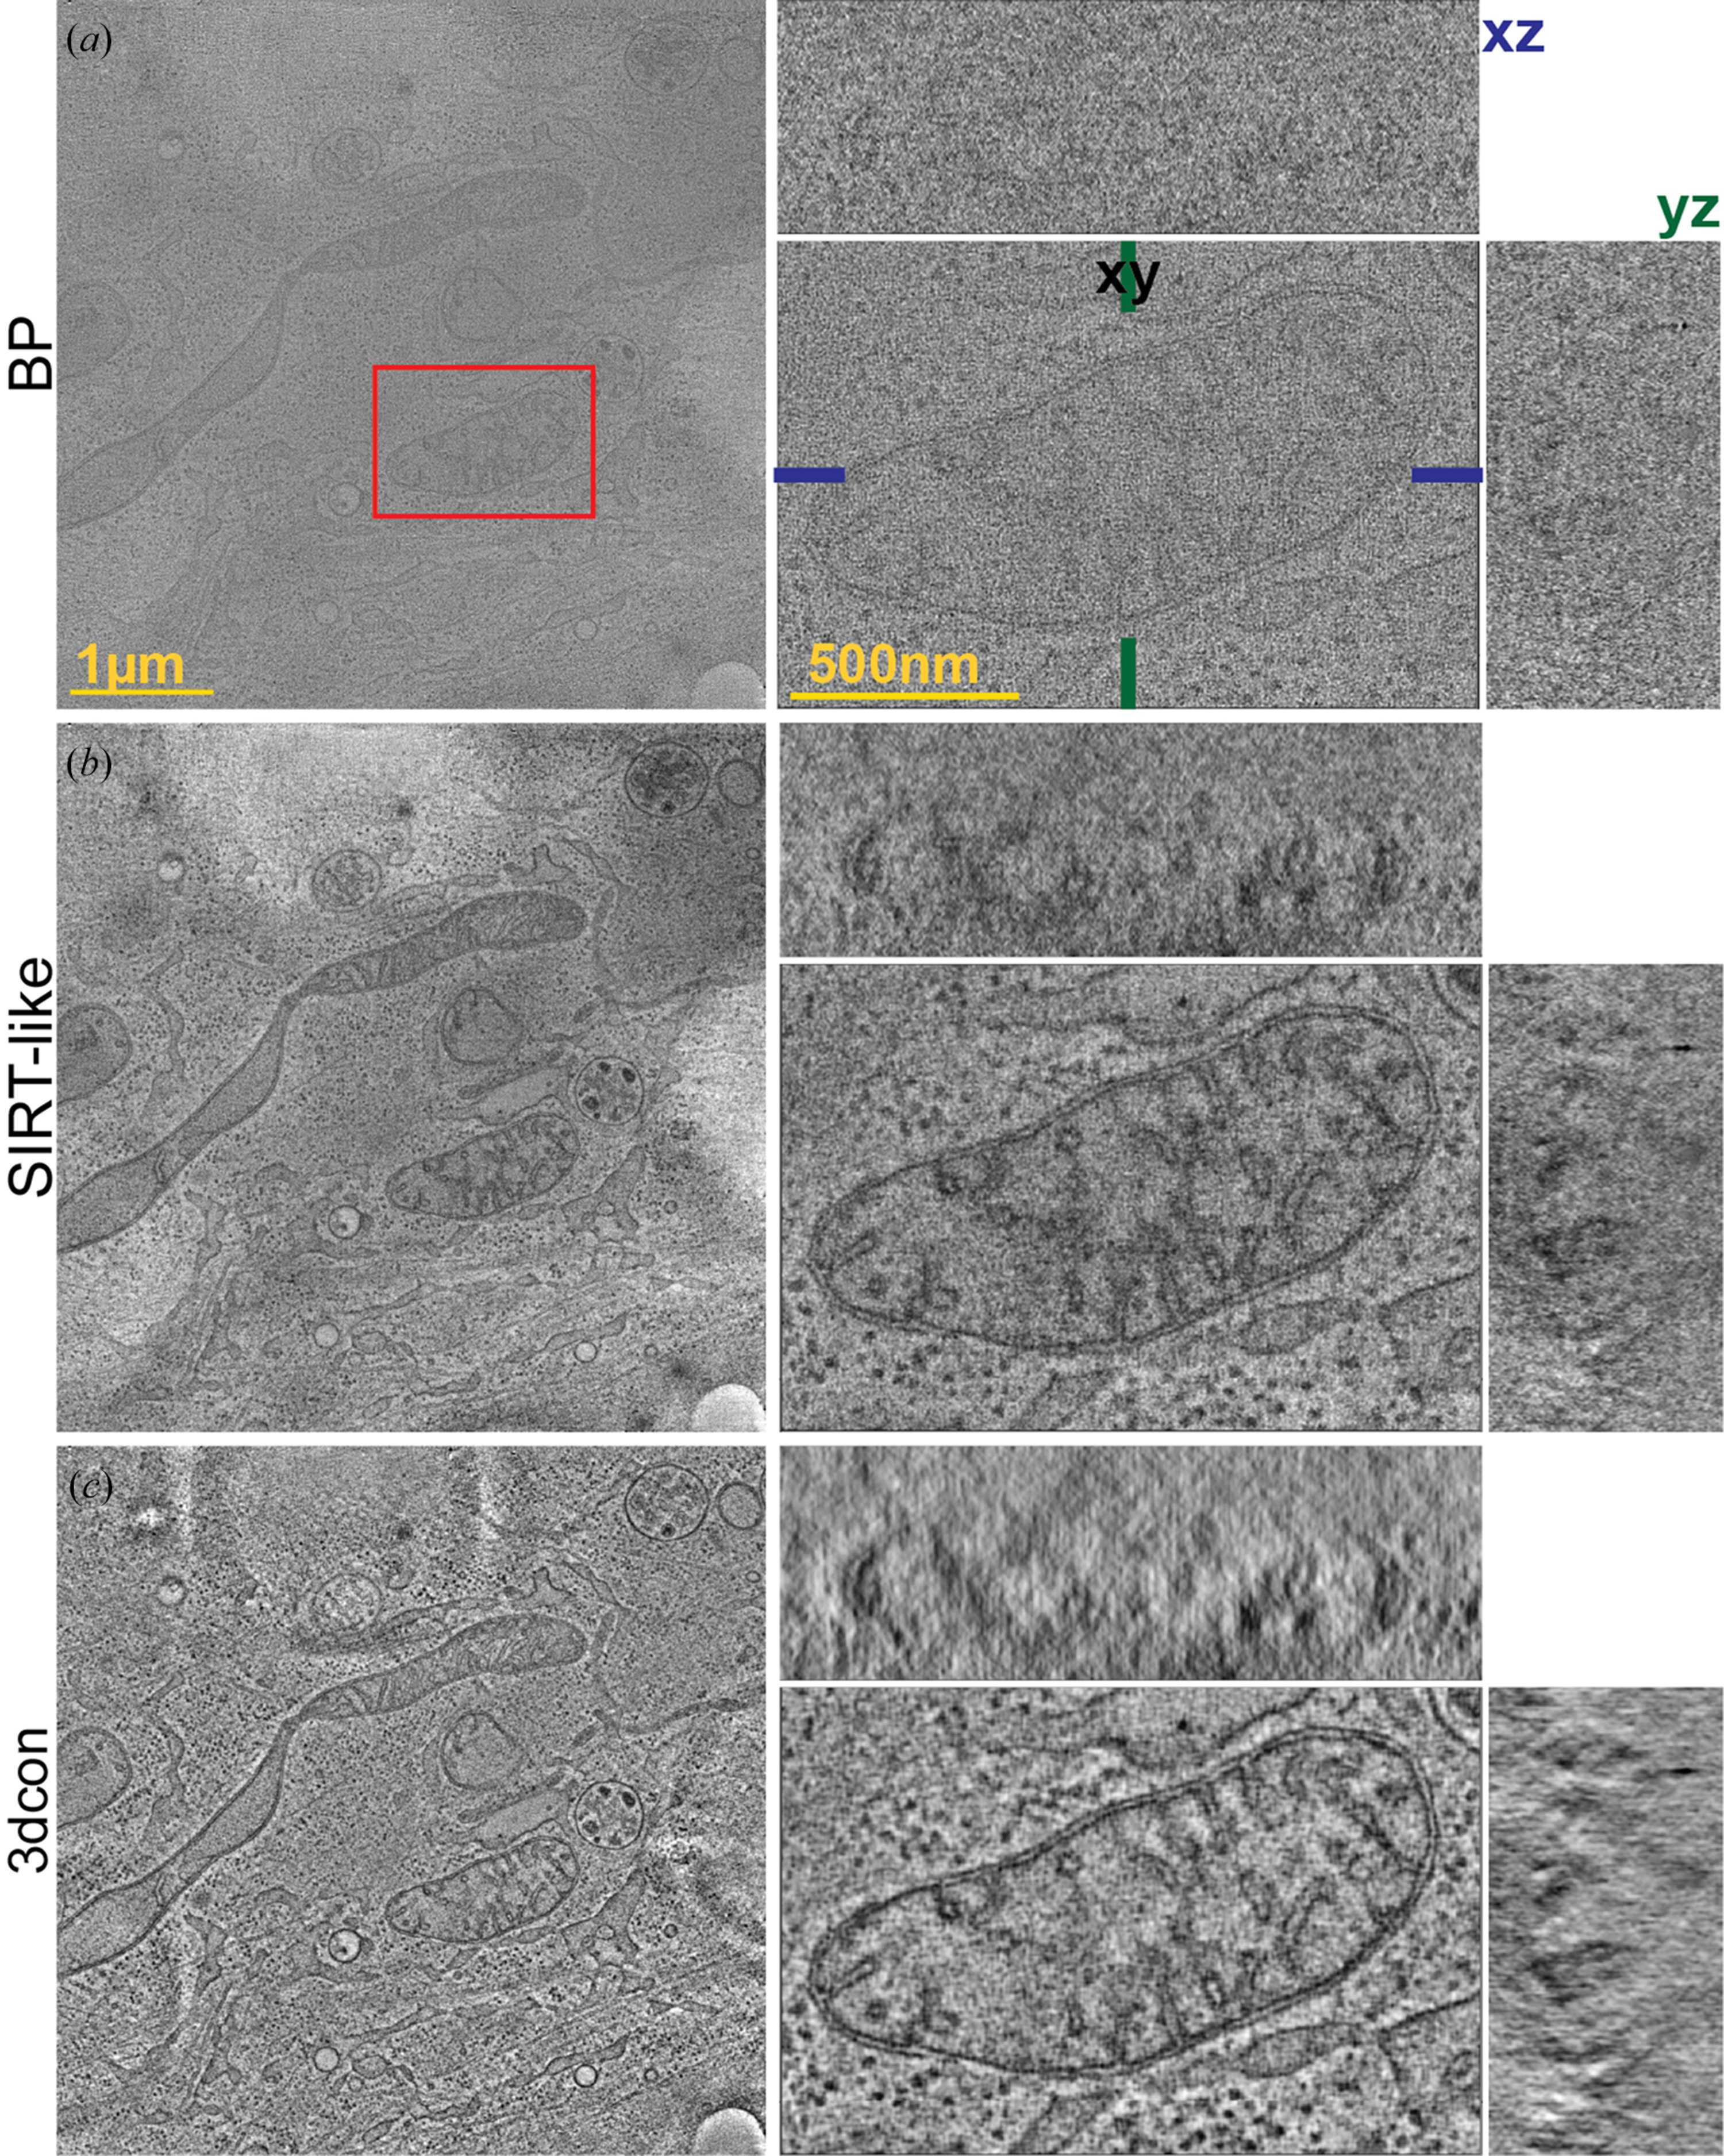
Figure 2
Comparison of (a) BP, (b) SIRT-like and (c) 3dcon for a dual-axis cryo-STET dataset (EMDB entry EMD-51764; Kirchweger, Wolf et al., 2025  ). The first column shows individual slices of the whole tomogram (scale 1). The second column zooms into one mitochondrion, as highlighted by the red box (scale 500) and shows the xy, xz and yz slices. Blue and green lines in the xy plane indicate the positions of the xz and yz planes. |
 | STRUCTURAL BIOLOGY |
ISSN: 2059-7983
Open  access