

 menu
|
|
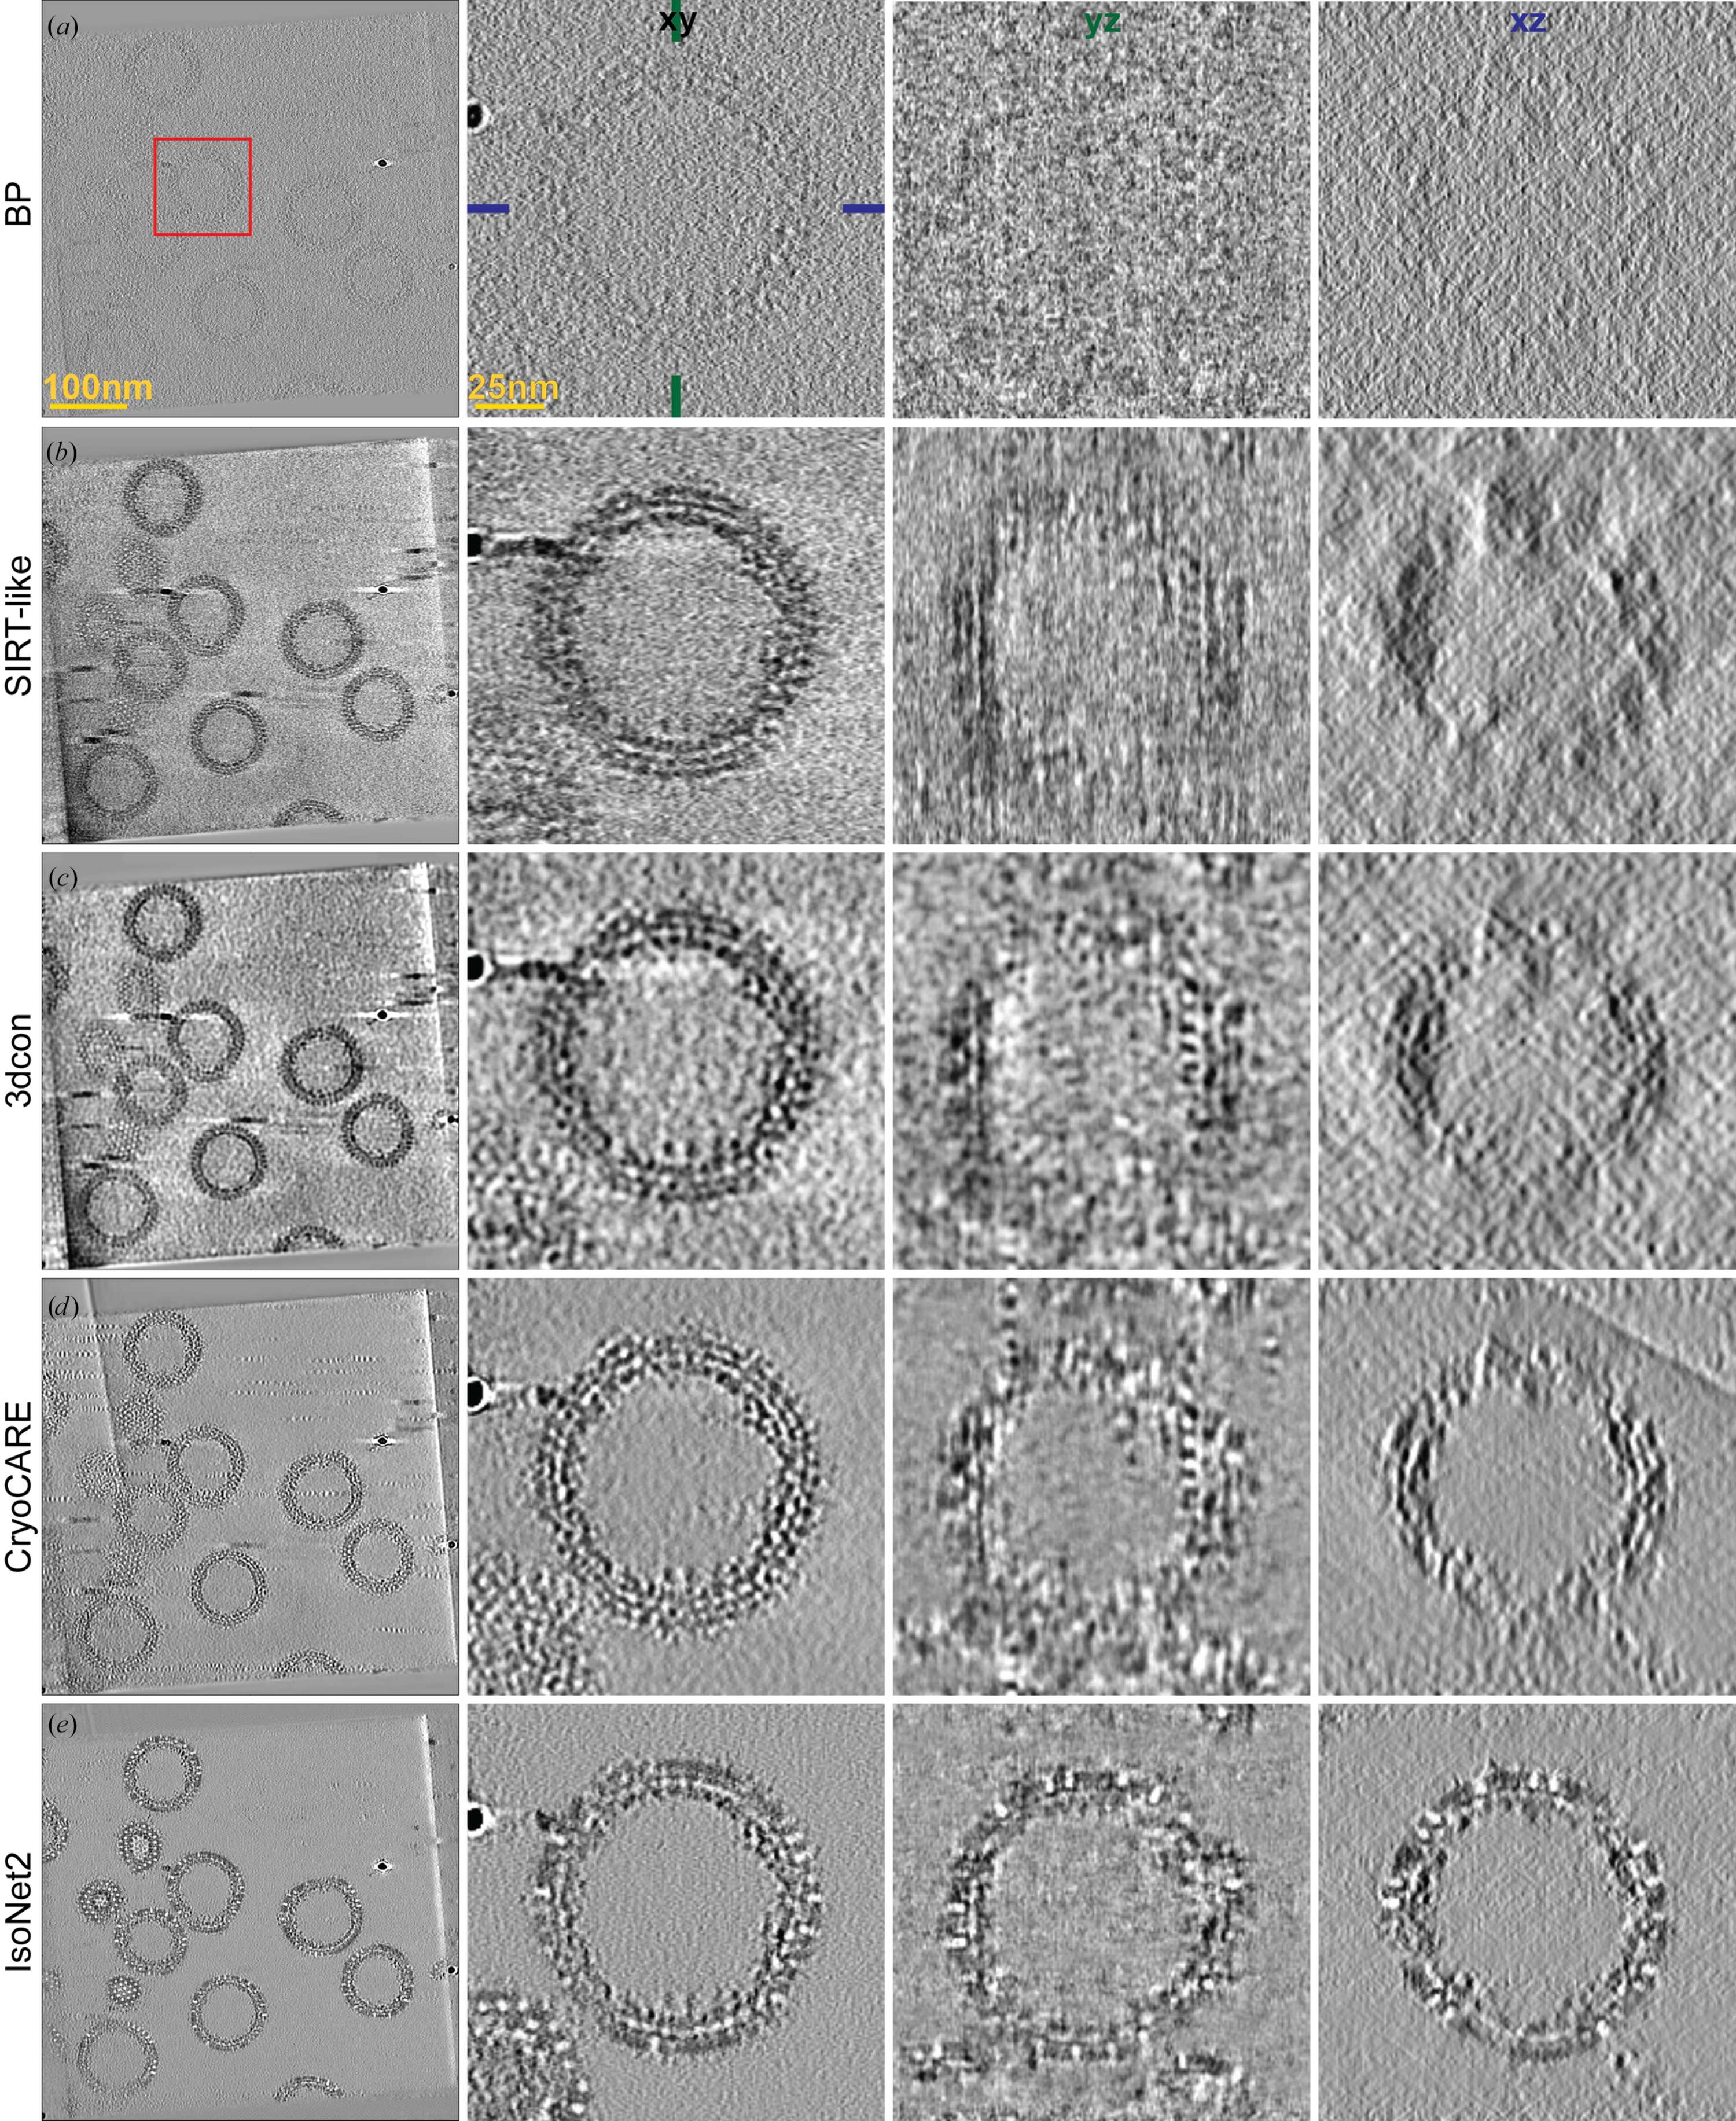
Figure 3
A cryo-TEM tomogram (EMPIAR-10164; Schur et al., 2016  ) processed with 3dcon: (a) the unweighted BP, (b) the SIRT-like filtered BP, (c) the 3dcon, (d) CryoCARE and (e) IsoNet2 of a slice in the tomogram. The first column shows the xy virtual section of the entire field of view; scale 100). The second, third and last columns show the xy, xz and yz cross-sections of a VLP (scale 25) highlighted by the red box. Blue and green lines in the xy plane indicate the positions of the xz and yz planes. |
 | STRUCTURAL BIOLOGY |
ISSN: 2059-7983
Open  access