

 menu
|
|
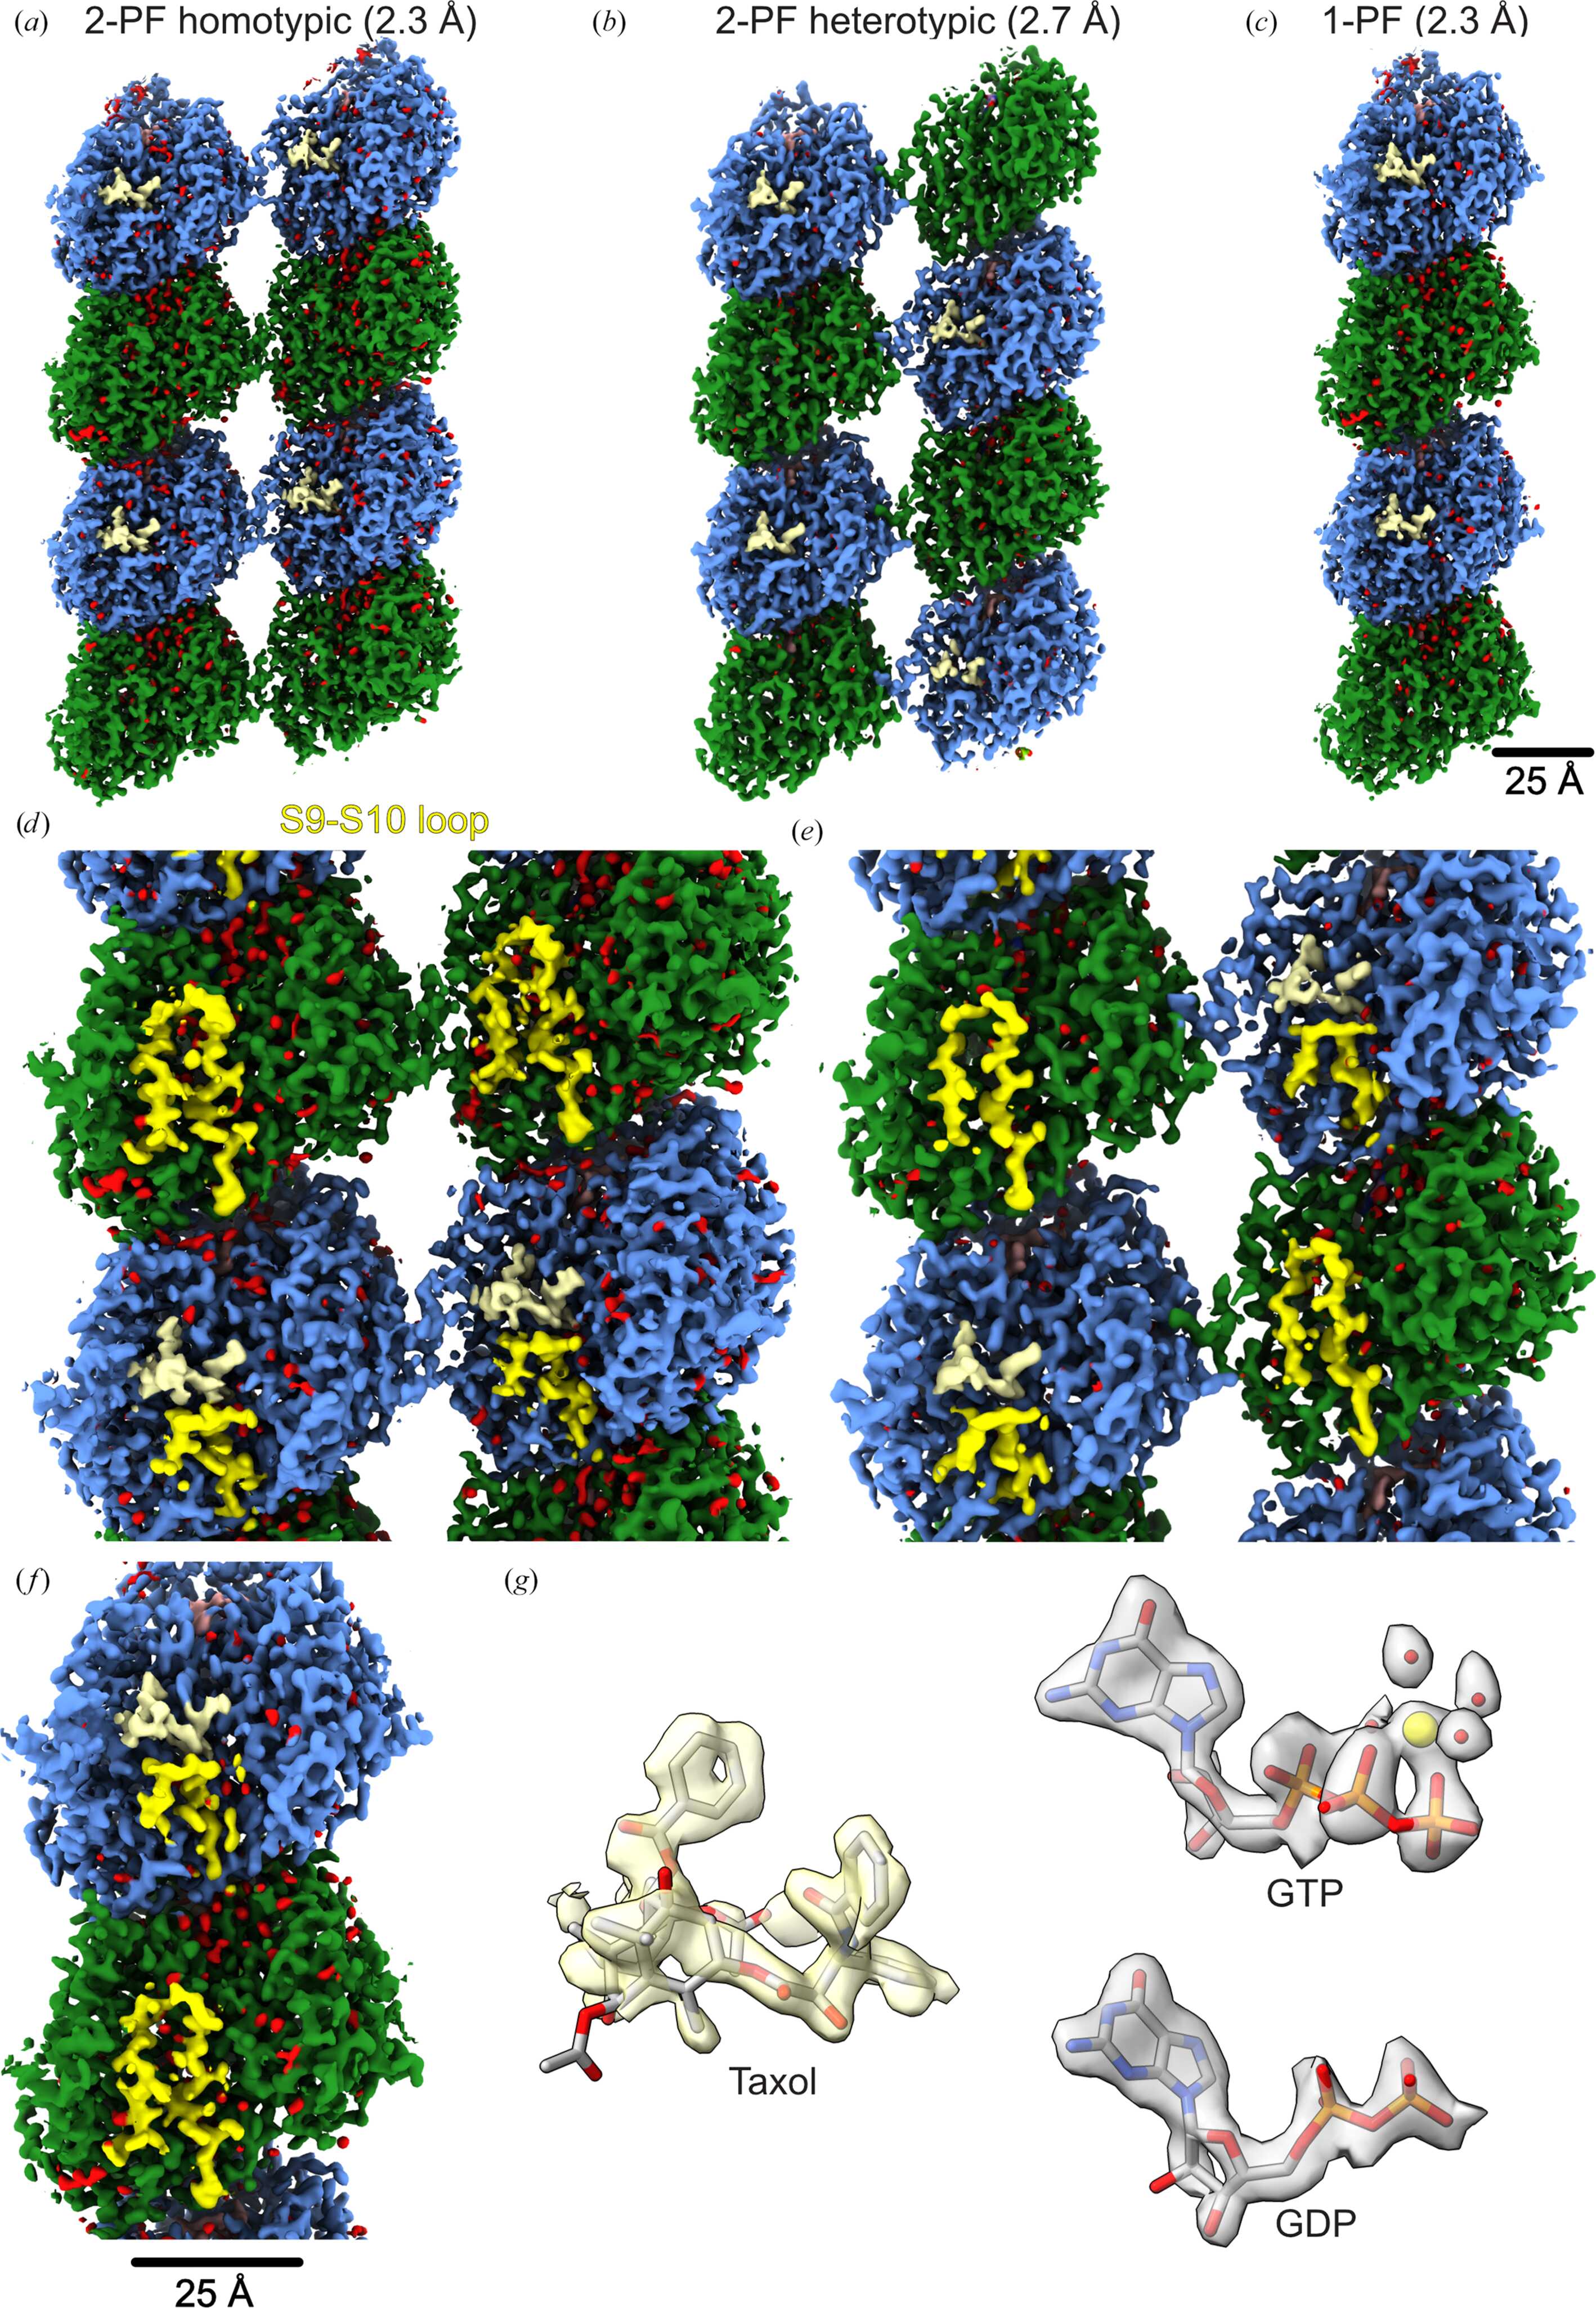
Figure 4
Processing of undecorated Taxol-bound human MTs using the CsMT workflow. (a) 2-PF homotypic (B-lattice) map at 2.3 Å resolution (2.2 Å using density modification; EMDB entry EMD-78103). (b) 2-PF heterotypic (A-lattice) map at 2.7 Å resolution (2.6 Å using density modification; EMDB entry EMD-78104). (c) 1-PF map at 2.3 Å resolution (2.2 Å using density modification; EMDB entry EMD-78112). Maps displayed were post-processed using Phenix density modification. Color: α-tubulin, green; β-tubulin, light blue; Taxol, beige; water, red; (d, e, f) Magnified views of 2-PF homotypic (d), 2-PF heterotypic (e) and 1-PF (f) maps show distinct densities for S9–S10 loops, a feature that distinguishes α- and β-tubulin. (g) Densities of Taxol, GDP and GTP from the 1-PF map. The GTP density shows magnesium densities (yellow) and water densities (red). |
 | STRUCTURAL BIOLOGY |
ISSN: 2059-7983
Open  access