Acta Crystallographica Section A
Acta Crystallographica
Section A FOUNDATIONS AND ADVANCES
Acta Crystallographica
Section A FOUNDATIONS AND ADVANCES


 menu
|
|
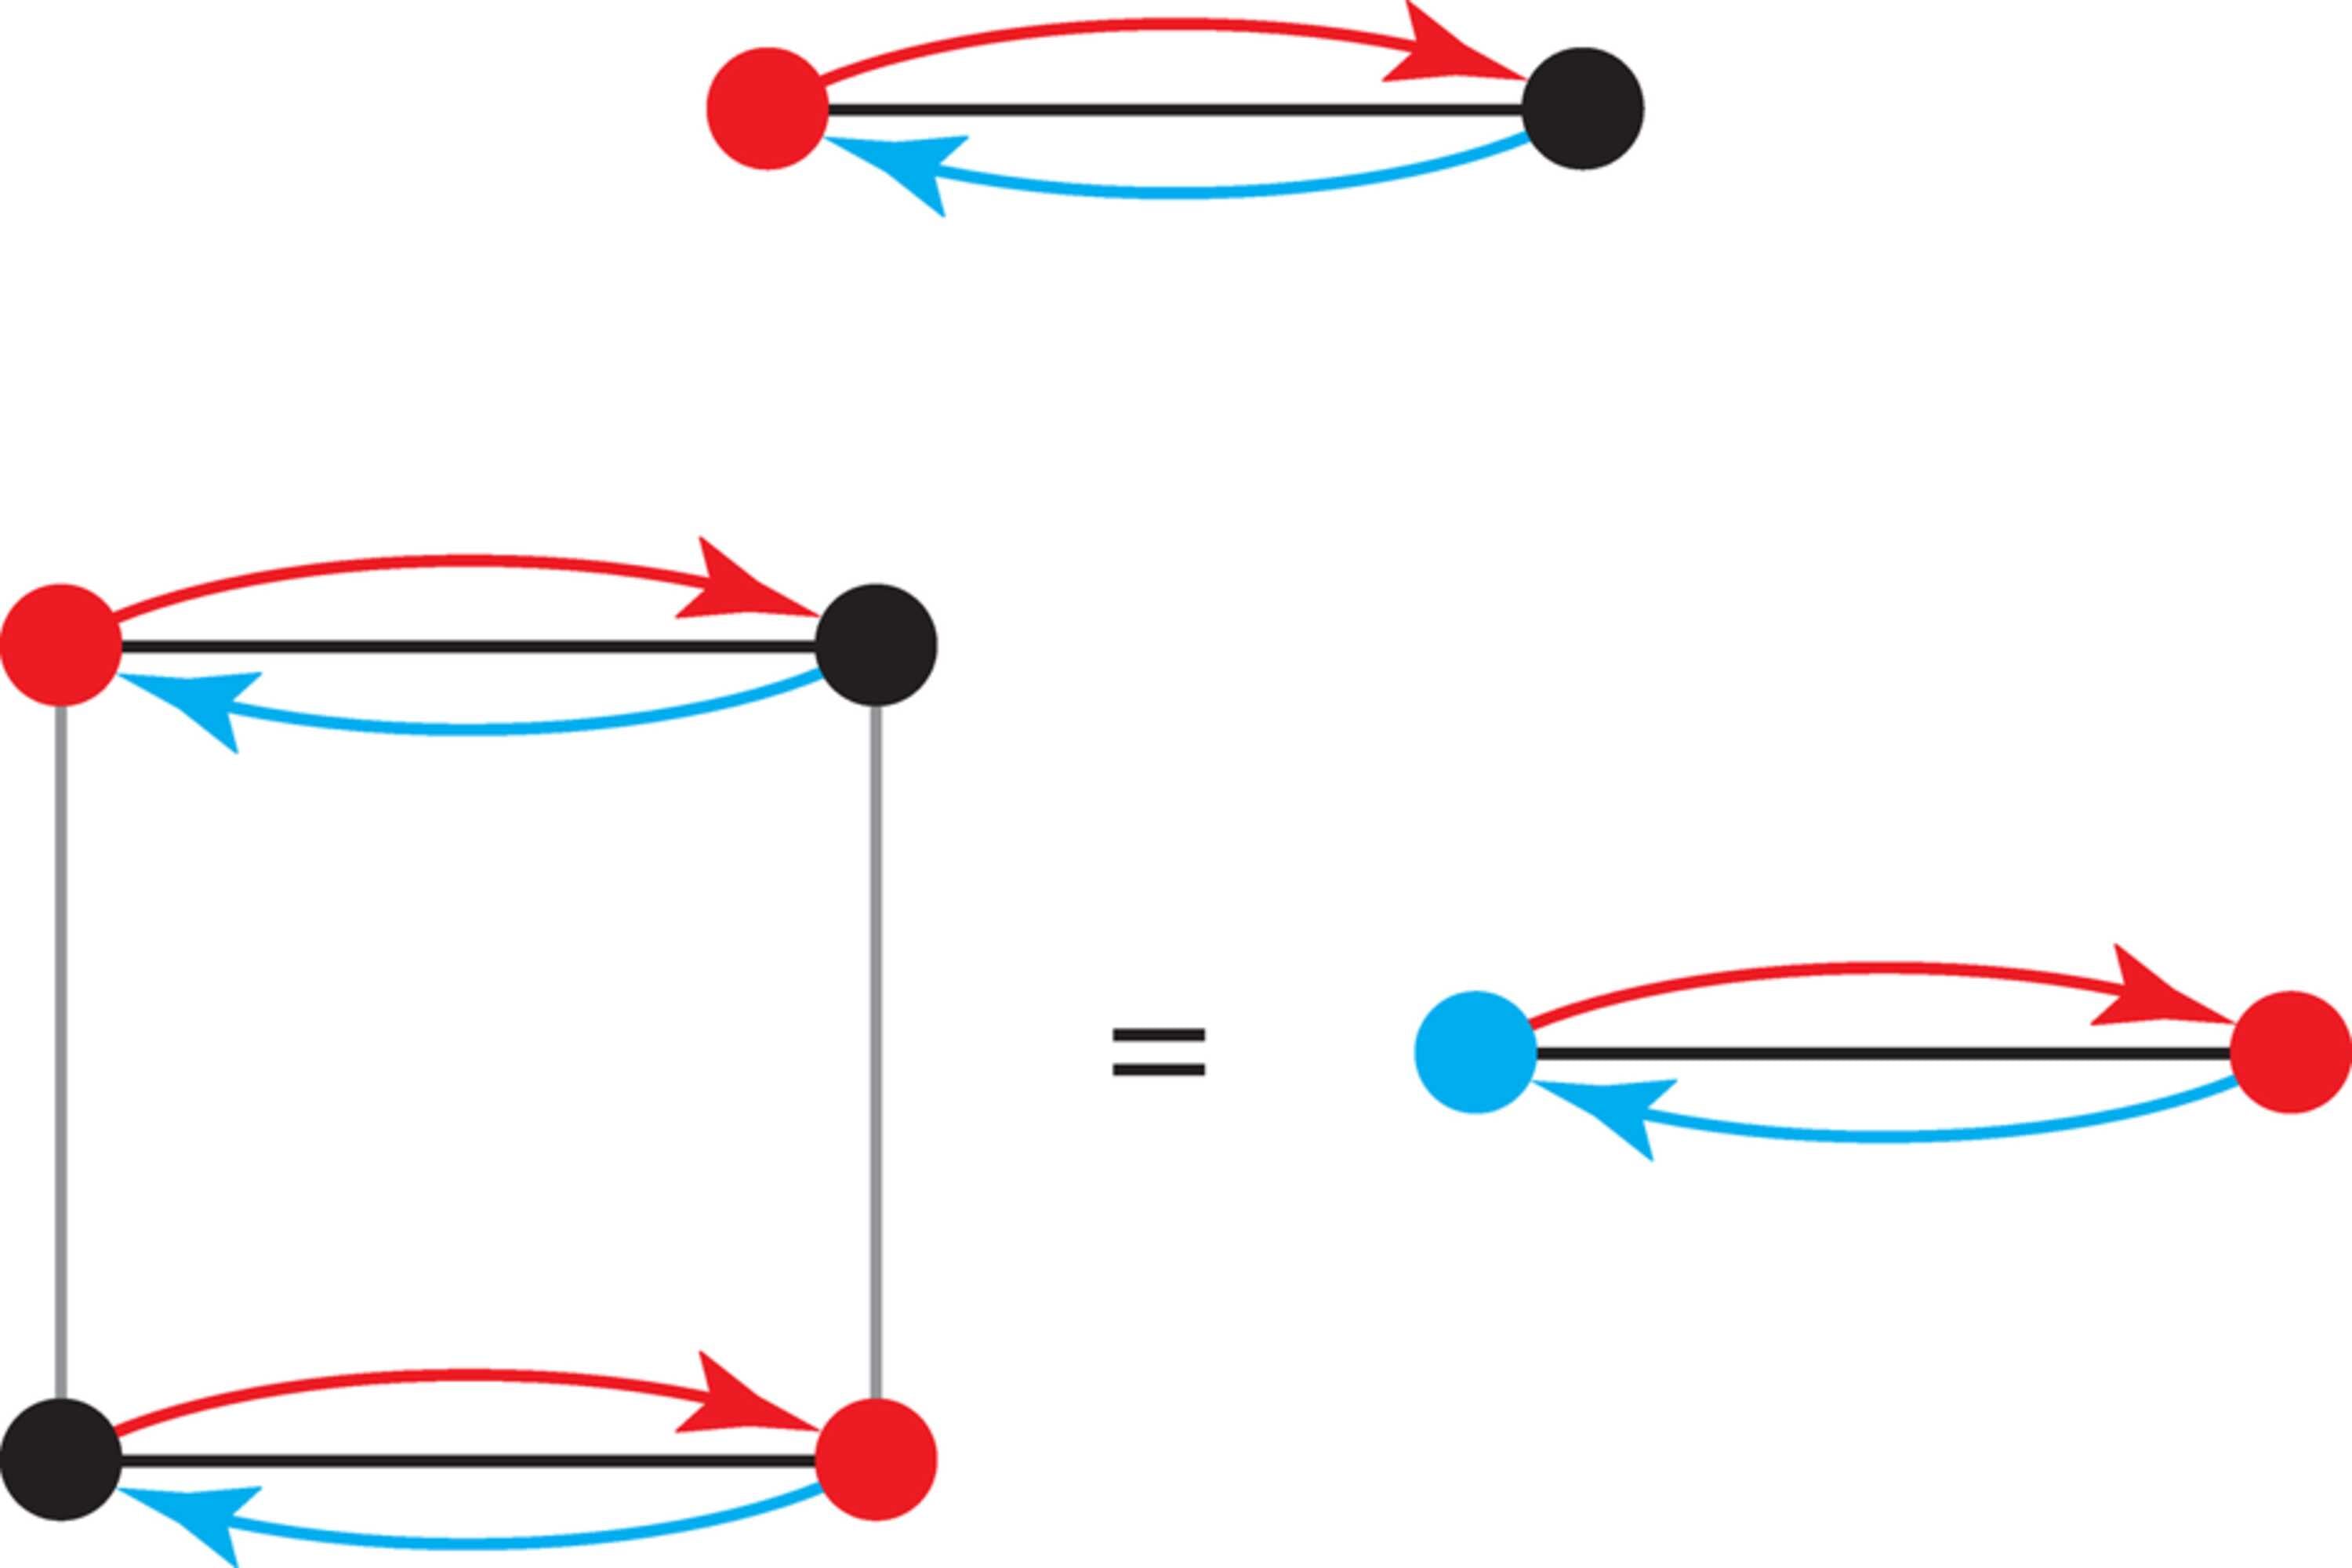
Figure 3
(Top) Labelled quotient graph of the net hcb, (bottom left) labelled quotient graph of the double net including the interaction between two opposite sheets represented as grey edges; oriented edges with voltage 10 (blue) and 01 (red). Red vertices define a maximum independent set. (Bottom right) A simpler representation with a different colour associated to independent subsets of each sheet. |
| FOUNDATIONS ADVANCES |
ISSN: 2053-2733
Open  access