
Acta Crystallographica Section A
Acta Crystallographica
Section A FOUNDATIONS AND ADVANCES
Acta Crystallographica
Section A FOUNDATIONS AND ADVANCES


 menu
|
|
Figure 7
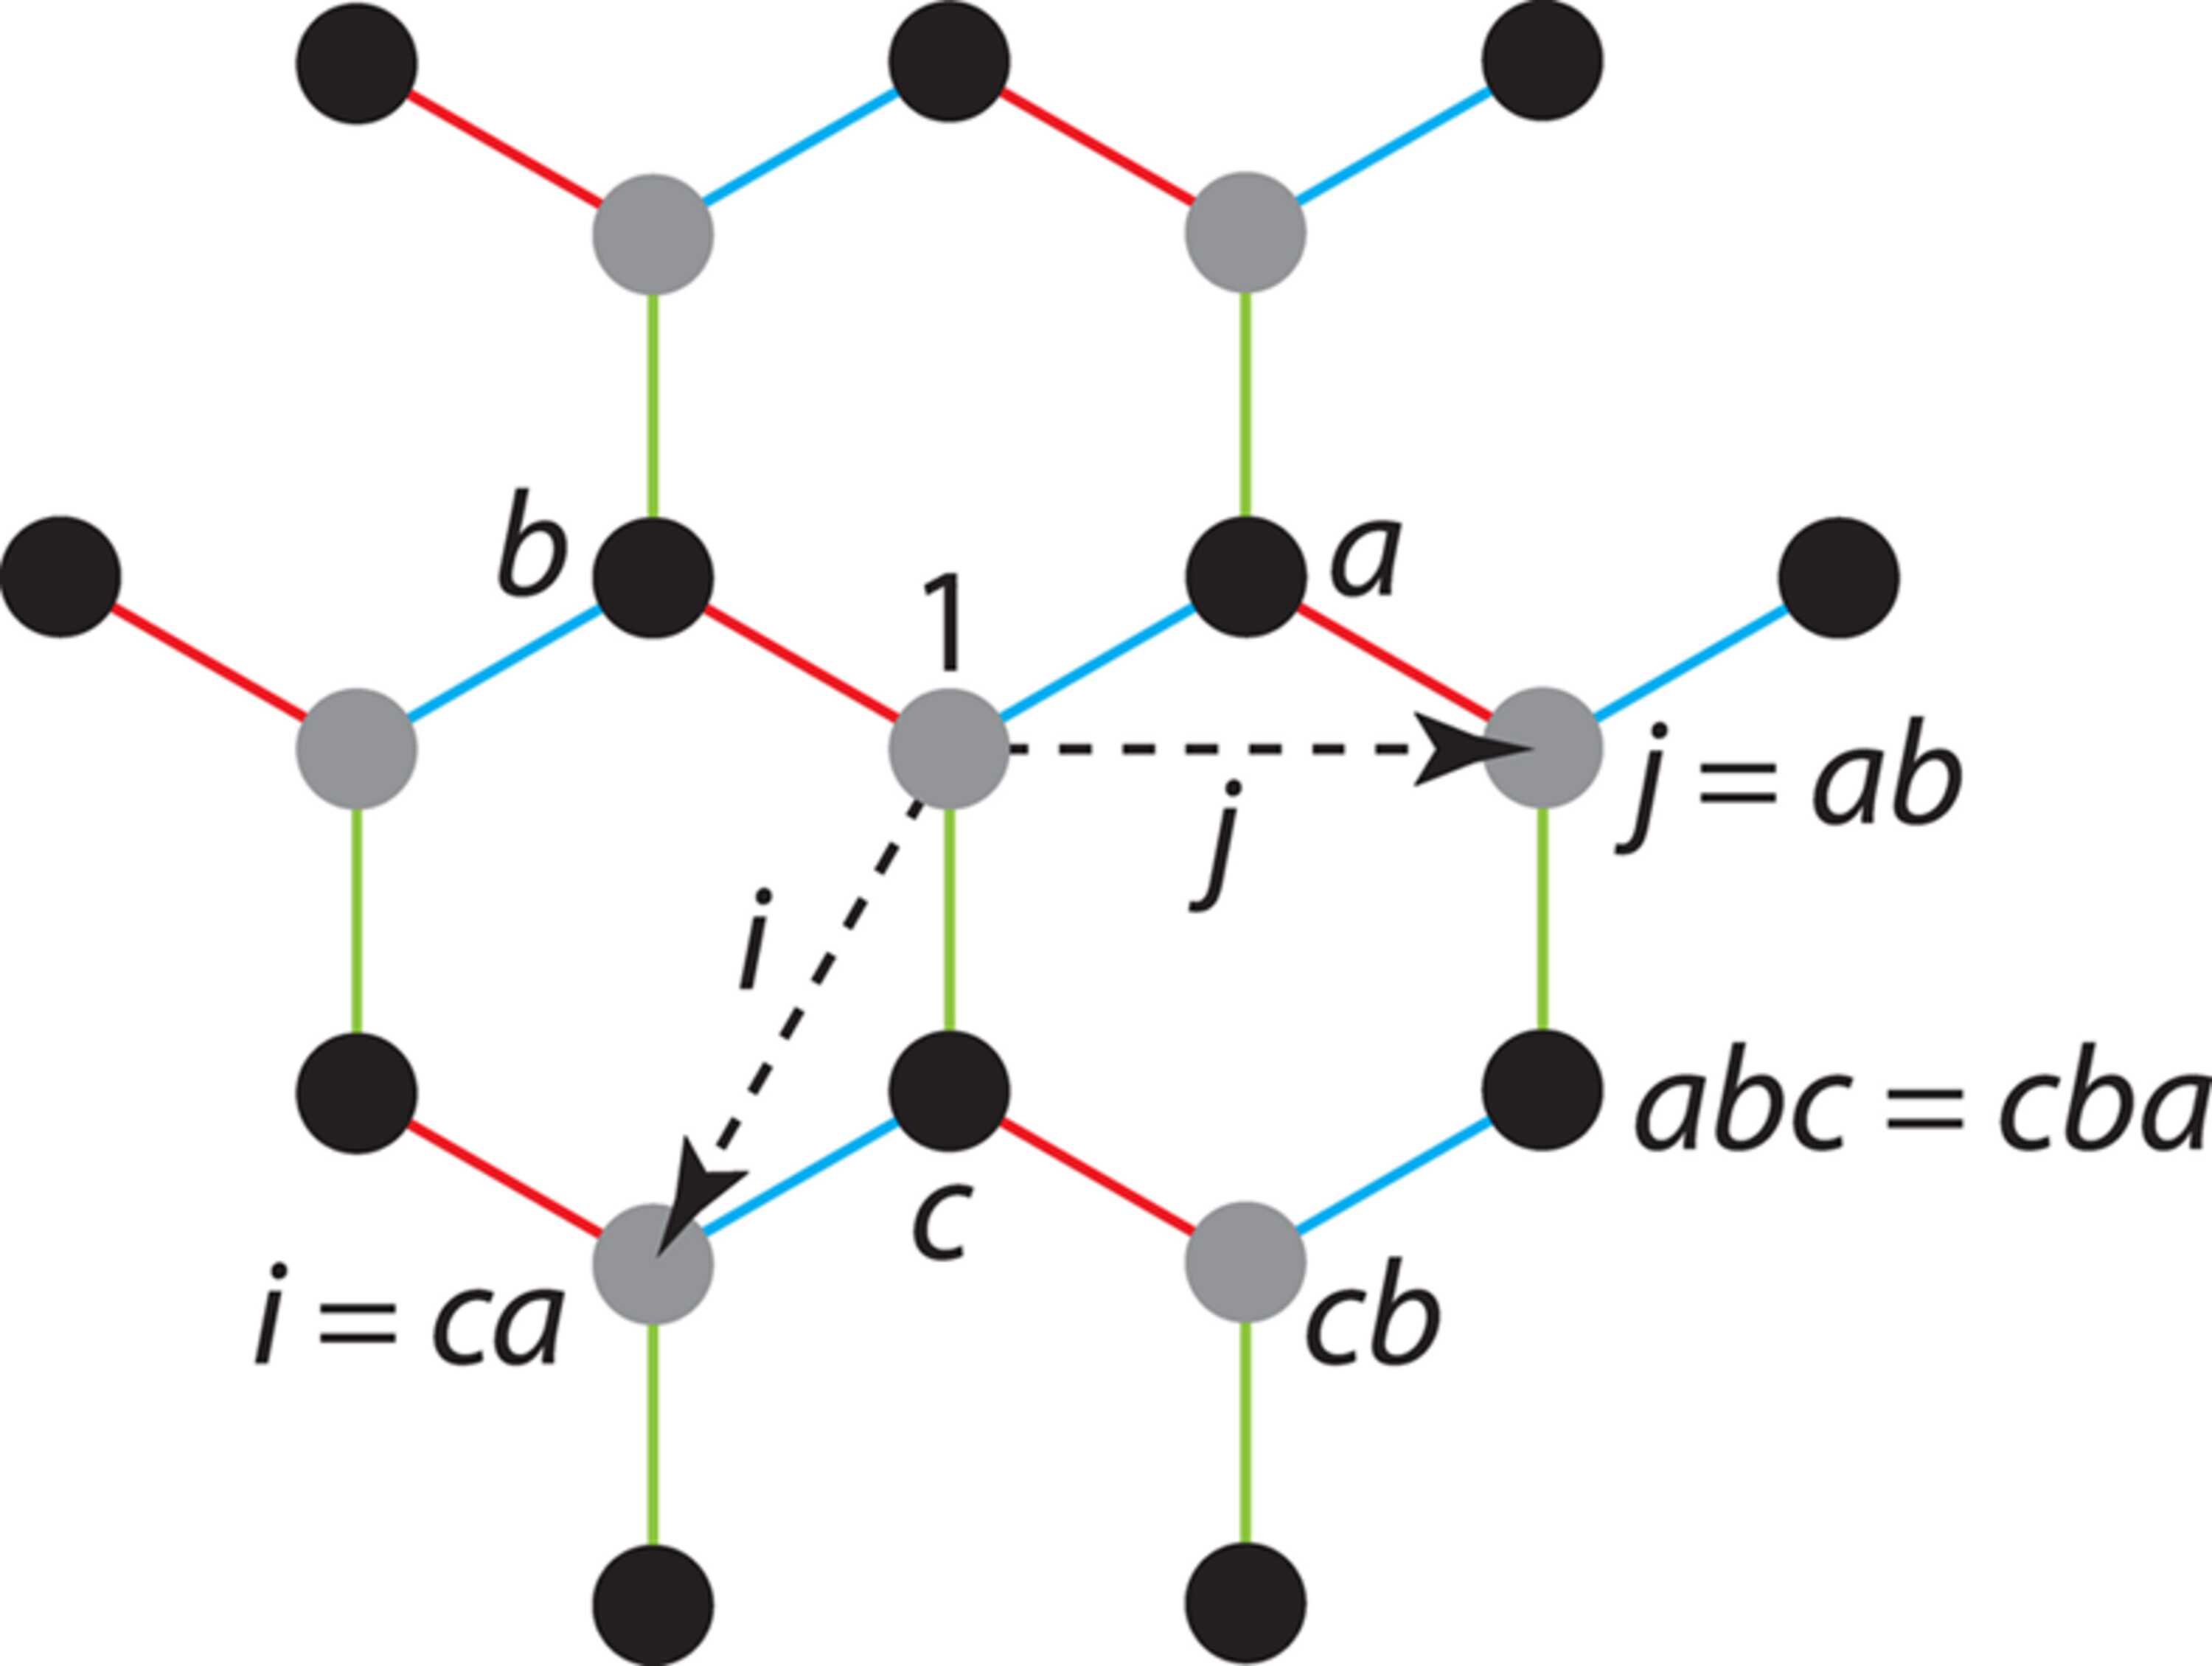
The hcb net as a Cayley colour graph; the three generators are represented as coloured edges: blue (a), red (b) and green (c). Vertex colours segregate the two parts of the bipartition. Basis vectors of the unit cell are defined as  (10),  (01). Vertex labels can be assigned once the origin (1) has been fixed. |
| FOUNDATIONS ADVANCES |
ISSN: 2053-2733
Open  access