
Acta Crystallographica Section A
Acta Crystallographica
Section A FOUNDATIONS AND ADVANCES
Acta Crystallographica
Section A FOUNDATIONS AND ADVANCES


 menu
|
|
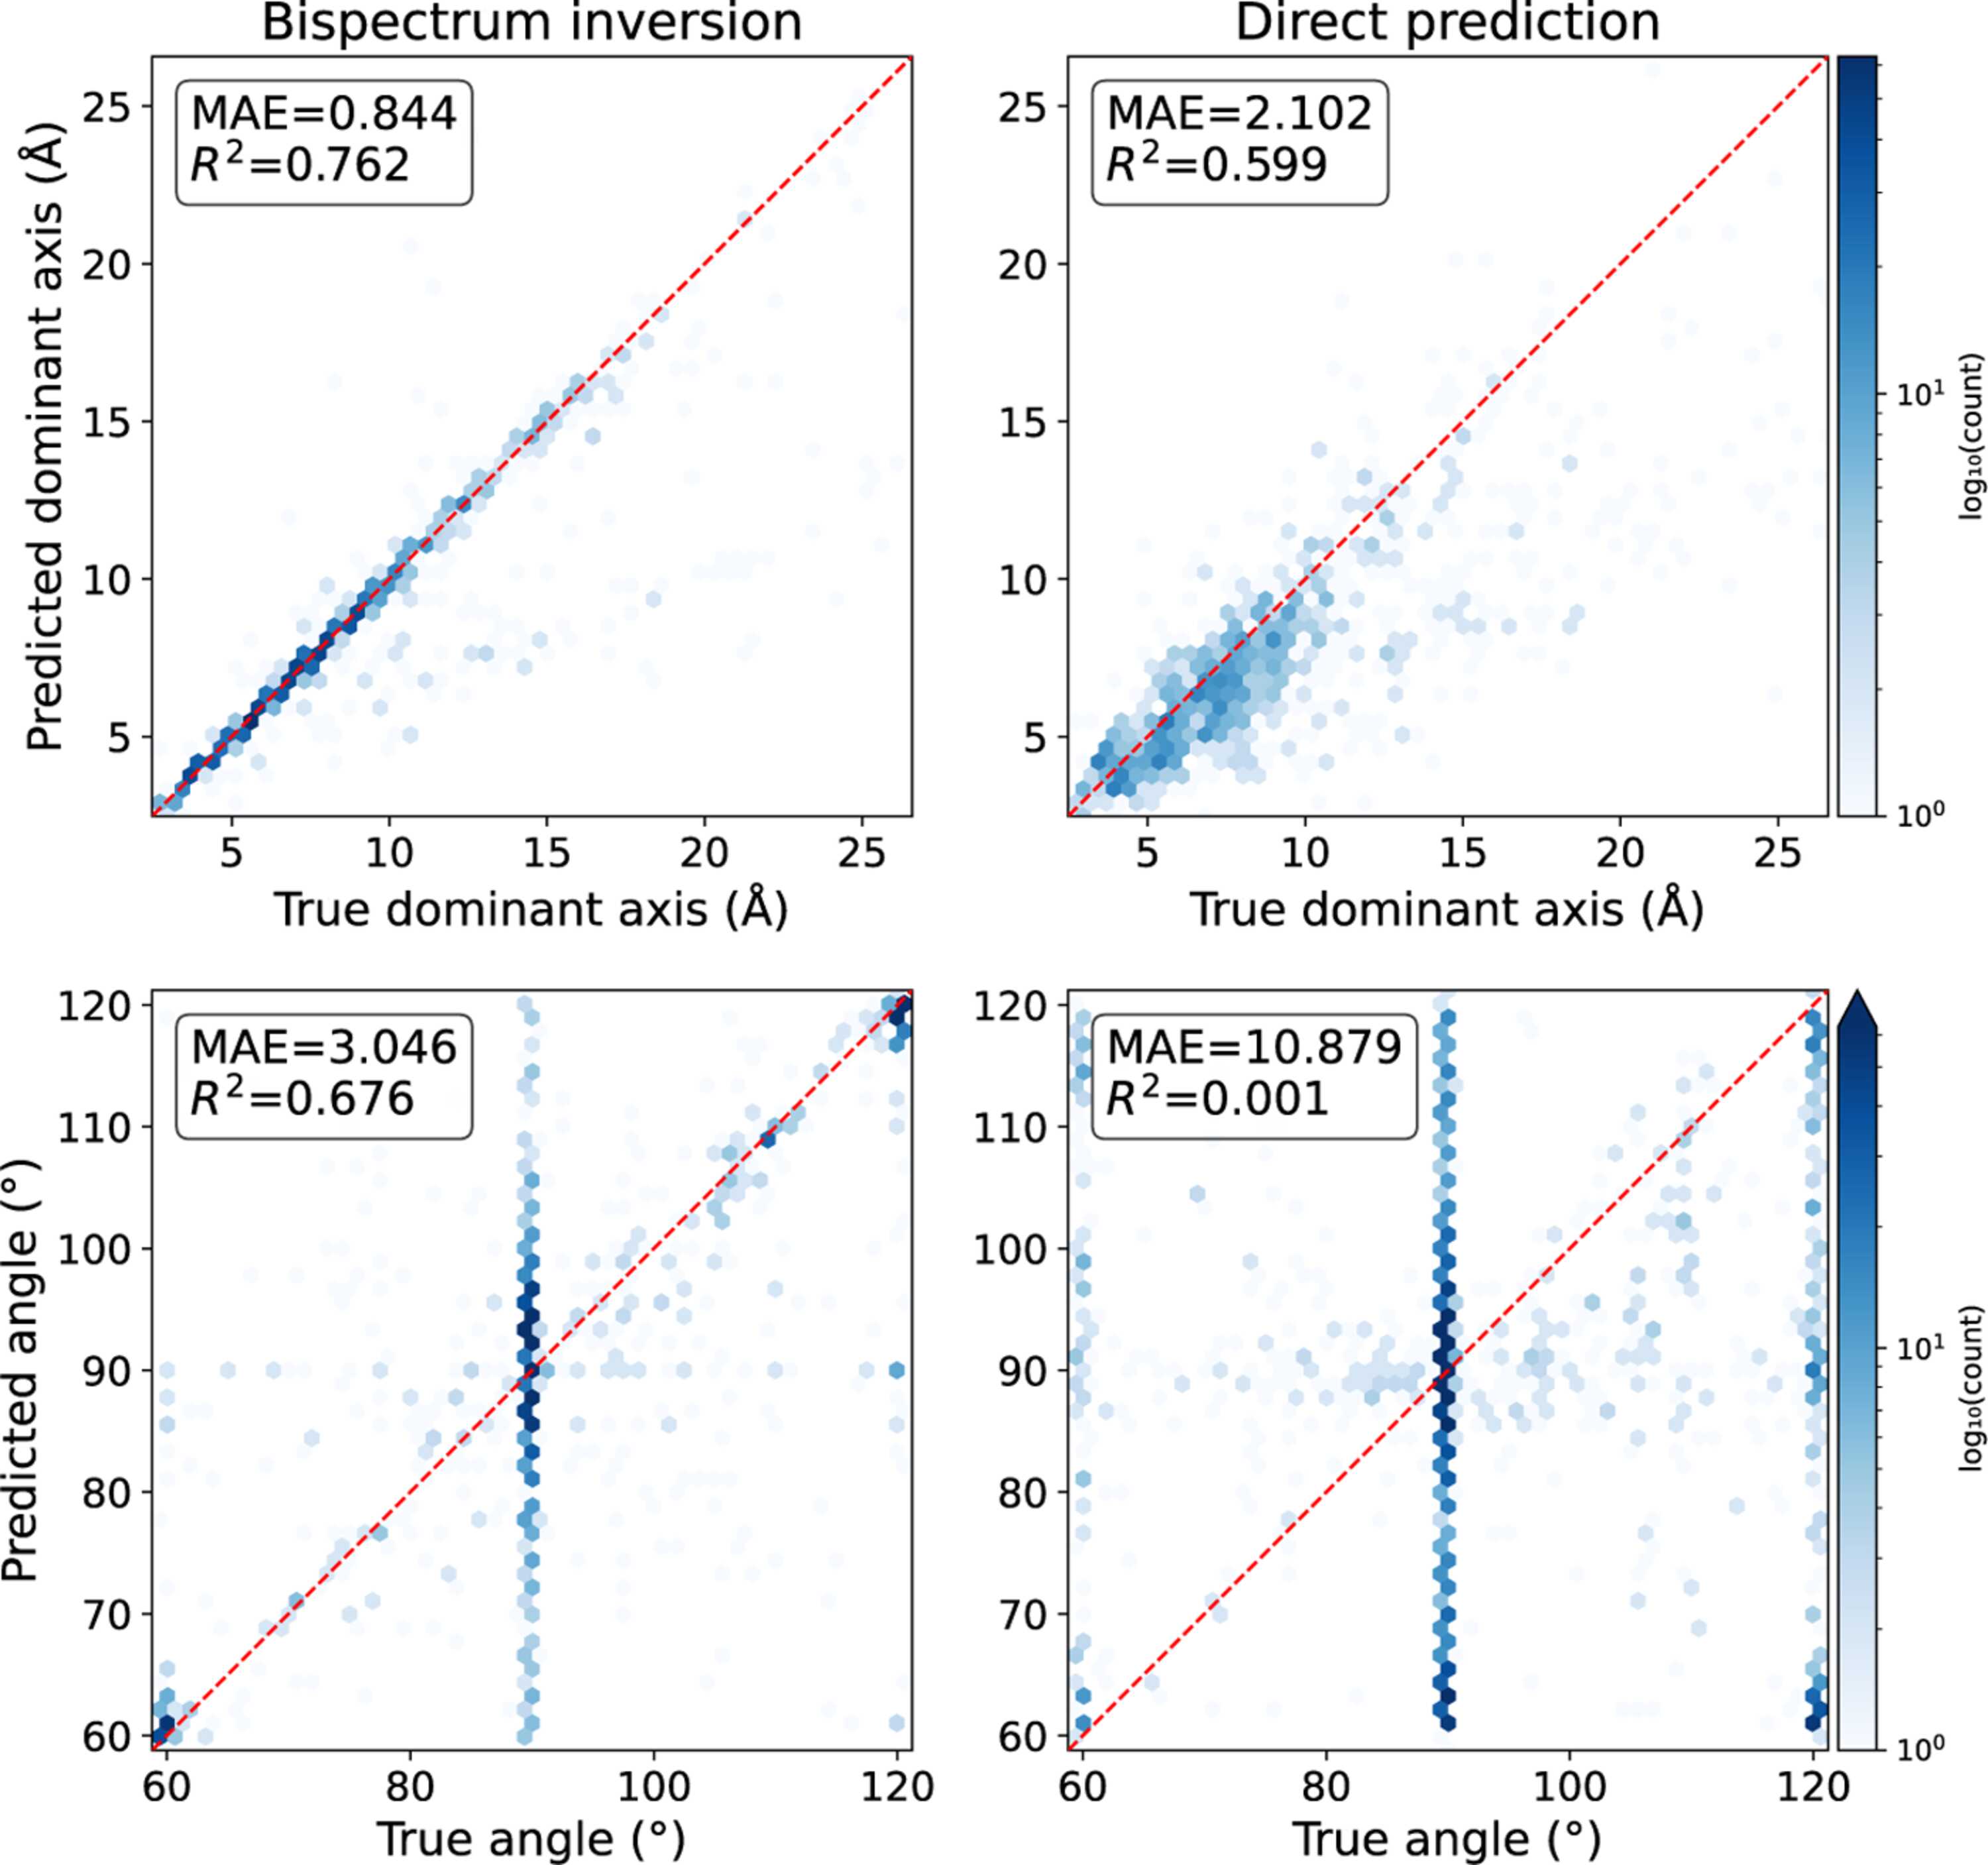
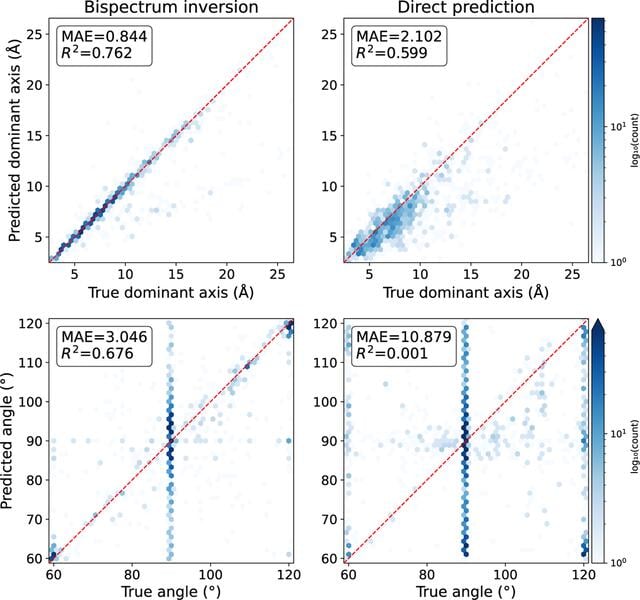
Figure 15
Parity plots for dominant zone structures (MP full test set, MP full augmented model), for bispectrum inversion (left) and direct lattice parameter prediction (right). Top: predicted versus true dominant (longest) axis. Bottom: predicted versus true lattice angles (α, β, γ pooled); the columns at 90° and 120° are angles fixed by symmetry – bispectrum inversion largely preserves them, while direct prediction scatters them over 60–120°. |
| FOUNDATIONS ADVANCES |
ISSN: 2053-2733
 access