
Acta Crystallographica Section A
Acta Crystallographica
Section A FOUNDATIONS AND ADVANCES
Acta Crystallographica
Section A FOUNDATIONS AND ADVANCES


 menu
|
|
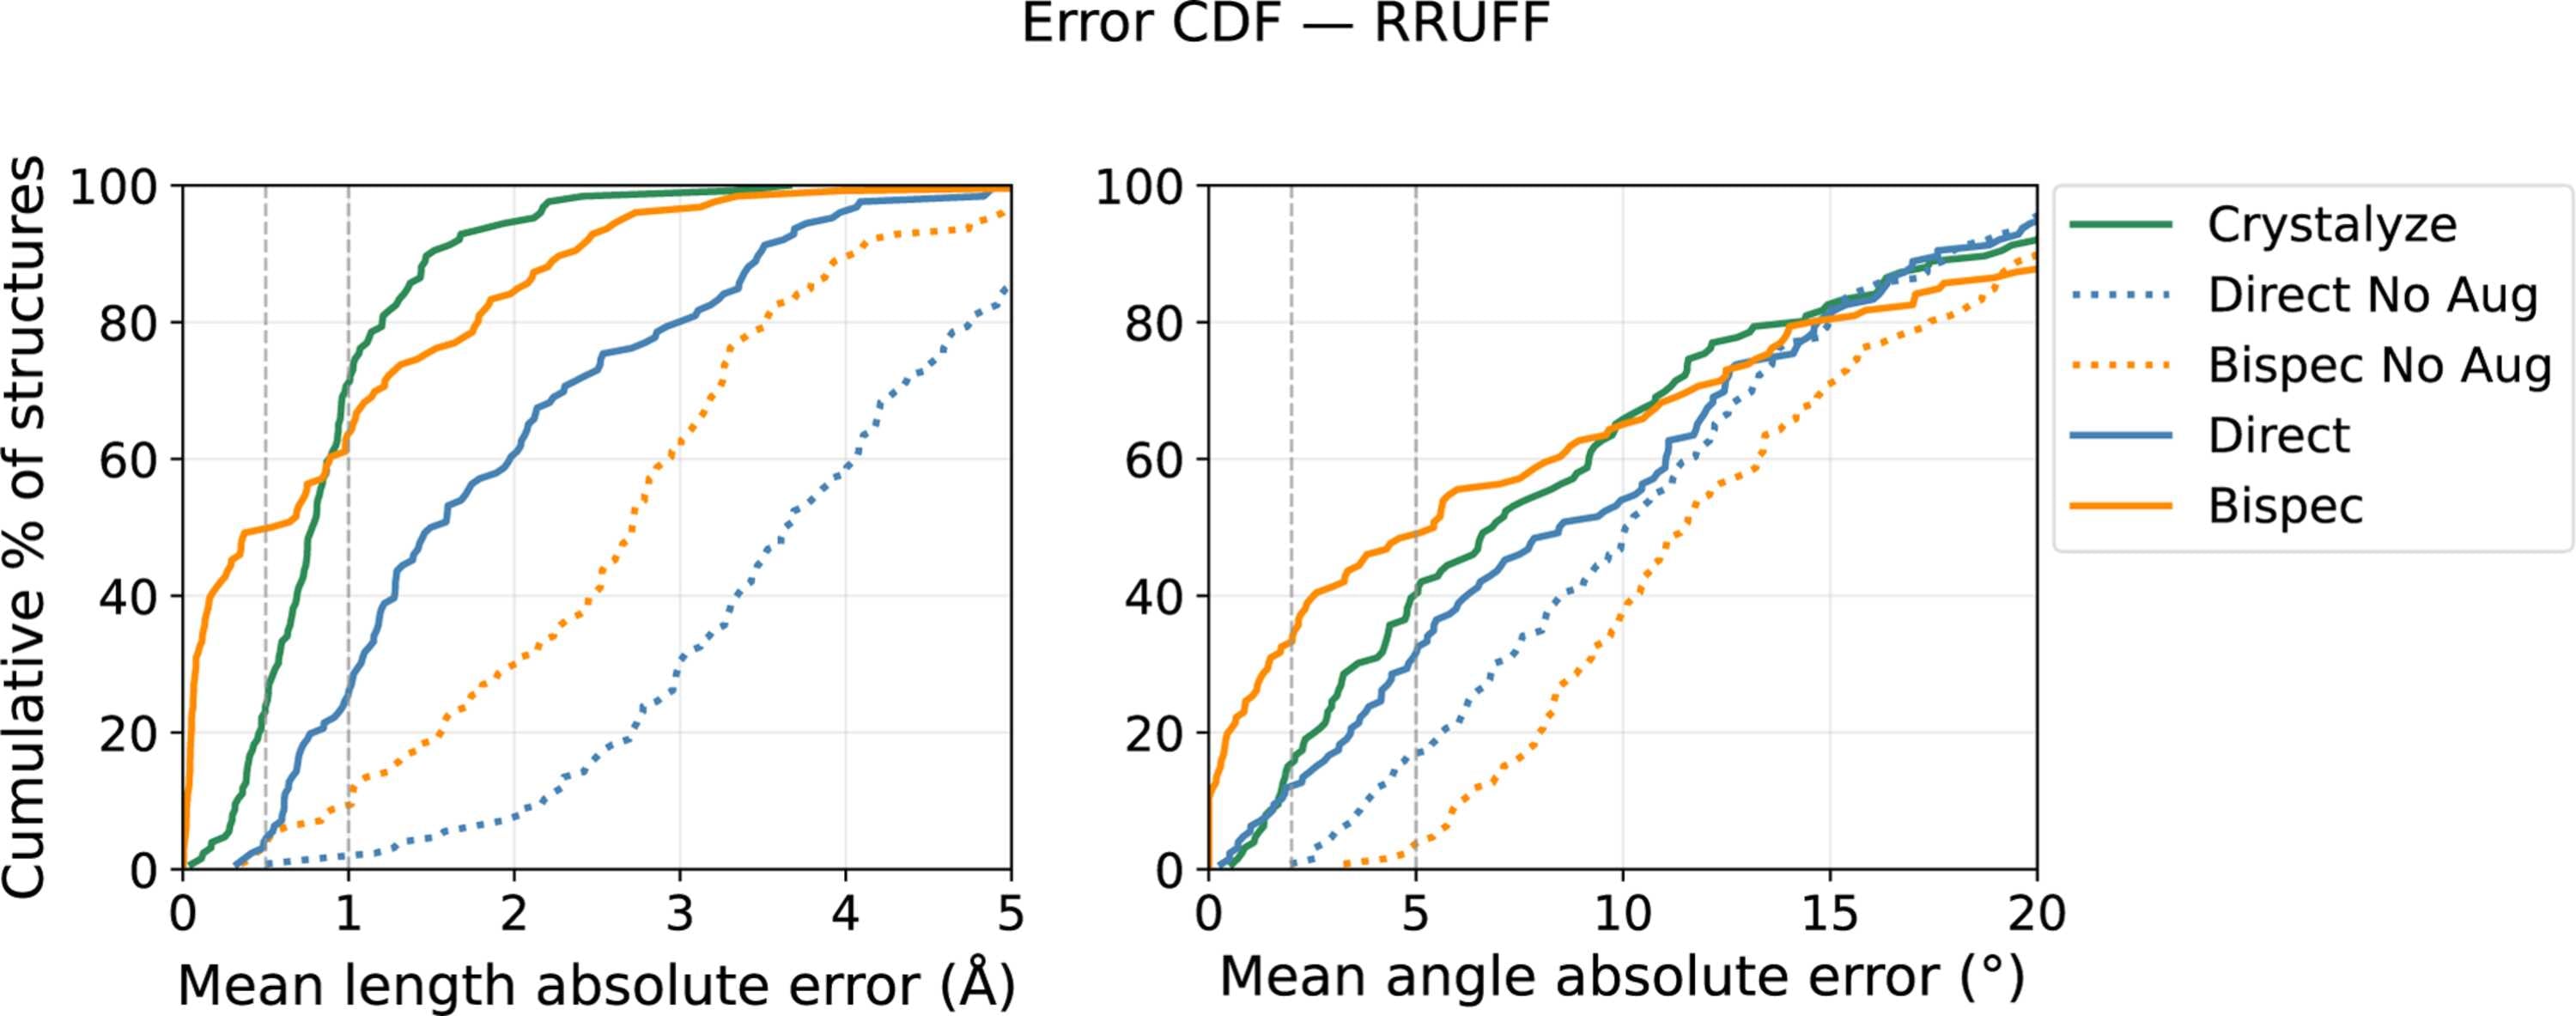
Figure 16
Cumulative distribution function for length and angle MAE for the RRUFF Crystalyze test set. The dashed lines correspond to the model trained on the MP-20 dataset with no augmentation, and the solid lines correspond to the model trained on the MP-20 dataset with augmentation as described in Section 5.1.1  . Augmentation clearly improves performance. |
| FOUNDATIONS ADVANCES |
ISSN: 2053-2733
 access