

 menu
|
|
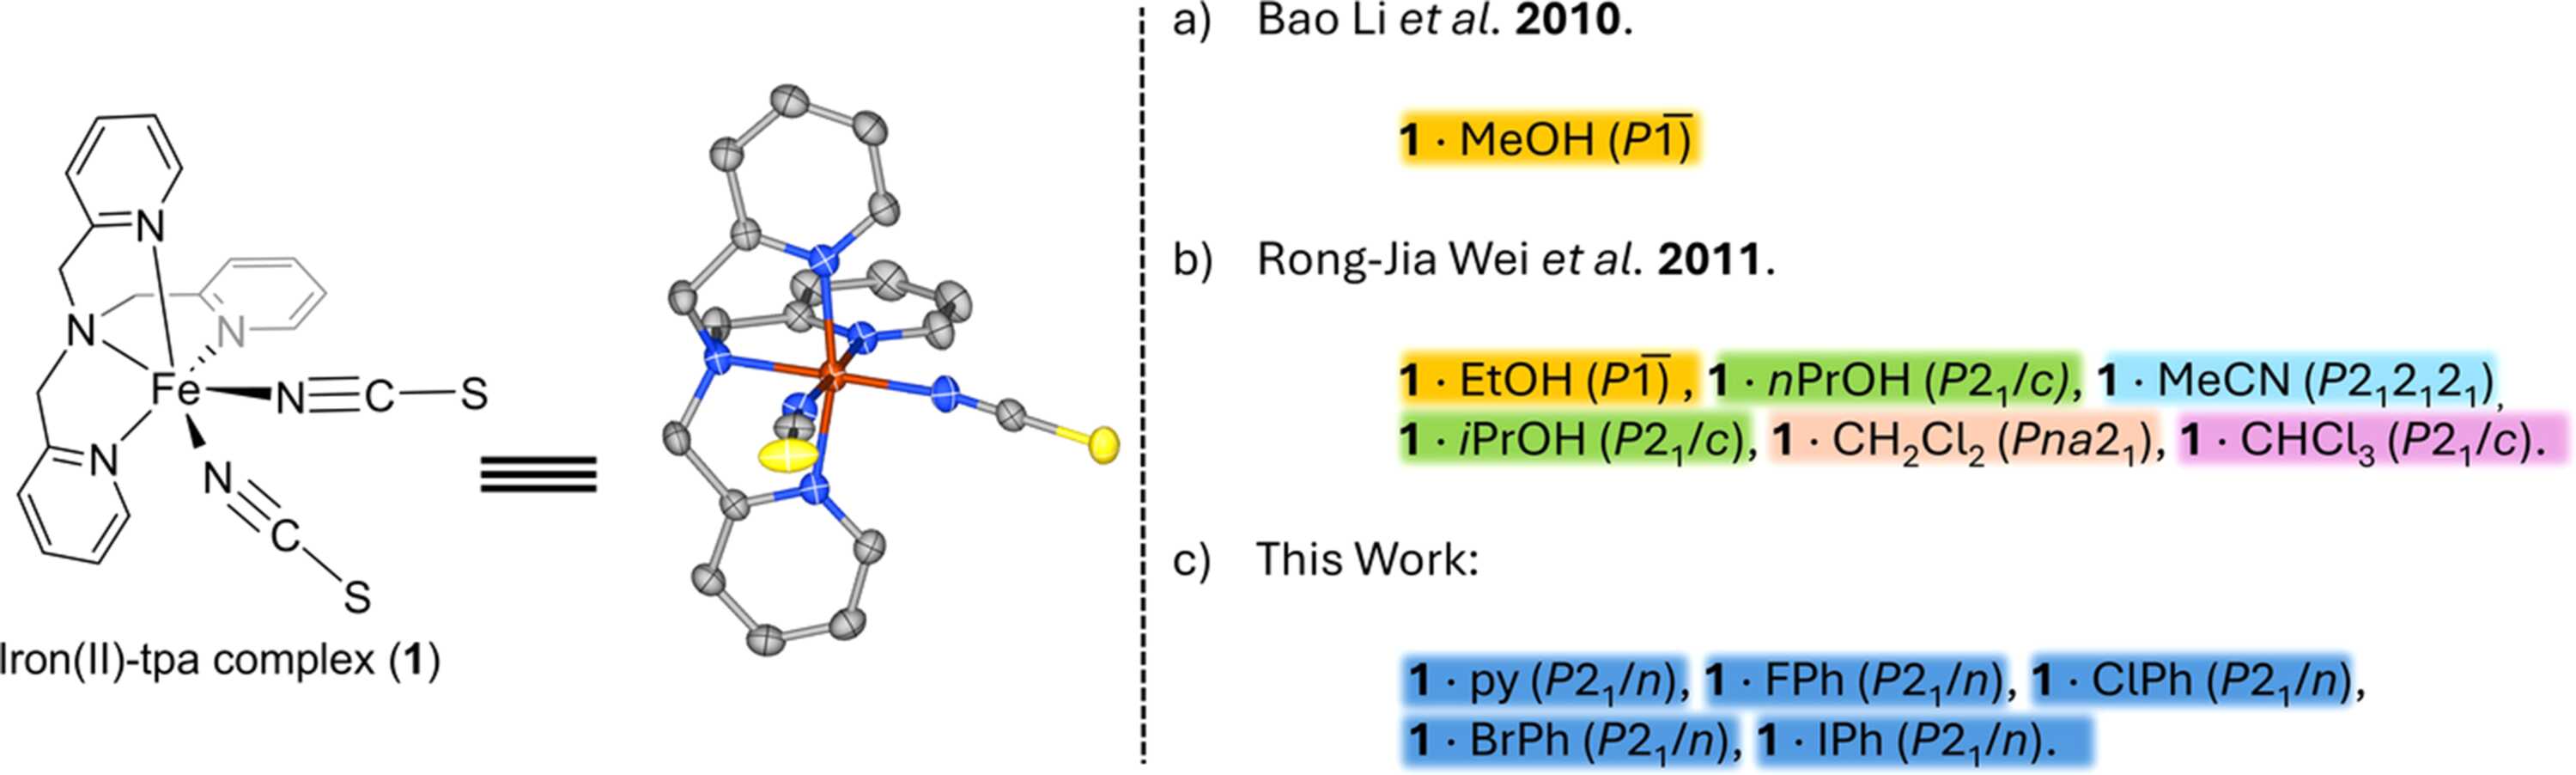
Figure 1
(Left) The molecular structure and representative ellipsoid plot (50% probability level) of [Fe(NCS)2(tpa)]. (Right) Overview of the reported solvatomorphs of compound 1, with the isostructural compounds colour-coded. |
 | STRUCTURAL CHEMISTRY |
ISSN: 2053-2296
Open  access