
Acta Crystallographica
Section E CRYSTALLOGRAPHIC COMMUNICATIONS


 menu


research communications
| CRYSTALLOGRAPHIC COMMUNICATIONS |
 access
analysis, Hirshfeld surface analysis and DFT calculations of a one-dimensional neutral manganese(II) coordination polymer [(CH3)3NH][MnCl2(H2O)2]Cl

aSchool of Electrical and Information Engineering, Fujian University of Technology, Fuzhou 350118, People's Republic of China, and bSchool of Science, Qingdao University of Technology, Qingdao 266250, People's Republic of China
*Correspondence e-mail: [email protected]
The of trimethylammonium manganese(II) chloride dihydrate or catena-poly[trimethylammonium [[diaquamanganese(II)]-di-μ-chlorido] chloride], {[(CH3)3NH][MnCl2(H2O)2]Cl}n (1), originally reported by Caputo et al. (1976 ). Acta Cryst. B32, 2639–2642], has been redetermined at 100 K. The structure retains the orthorhombic space group Pnma and the coordination connectivity of the previously reported room-temperature structure. Each MnII ion lies on an inversion centre and is coordinated by four bridging chloride ligands and two mutually trans water molecules. The resulting edge-sharing MnCl4(H2O)2 octahedra form neutral chains parallel to the b axis, with trimethylammonium cations and non-coordinating chloride anions situated between the chains. The measured unit-cell parameters, bond lengths and bond angles are in good agreement with the room-temperature determination reported by Caputo et al. In the crystal, O—H⋯Cl and N—H⋯Cl contacts link the inorganic and organic components. Hirshfeld surface analysis identifies H⋯Cl/Cl⋯H contacts as the largest surface-area contribution. Crystal morphology predictions and periodic density functional theory (DFT) calculations provide supplementary descriptions of the crystal habit and electronic response.
Keywords: crystal structure; chloride-bridged chain; hydrogen bonding; Hirshfeld surface analysis; DFT calculations.
CCDC reference: 2548320
1. Chemical context
Chloride-bridged manganese(II) compounds provide structurally simple examples of extended coordination assemblies. In these materials, bridging chloride ligands can connect MnII centres into chains, while coordinated water molecules and organic ammonium ions participate in hydrogen-bonding contacts between the inorganic and organic components. Their structural description therefore requires consideration of both the metal–ligand connectivity and the interactions between neighbouring chains.
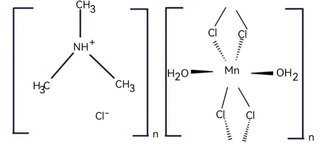
The of trimethylammonium manganese(II) chloride dihydrate, [(CH3)3NH]·[MnCl2(H2O)2]·Cl, was established by Caputo et al. (1976). Their study identified neutral chains of edge-sharing MnCl4(H2O)2 octahedra, together with trimethylammonium cations and discrete chloride anions between the chains. It also described hydrogen bonding between the chains and discussed the structure in relation to the magnetic behaviour of this family of compounds. The identity and principal structural features of the title compound are therefore already established.
The present work reports an independent determination of this structure at 100 K. Hirshfeld surface analysis is used to describe the relative surface-area contributions of different contact types. A geometrical crystal morphology model and periodic density functional theory calculations are included as complementary analyses.
2. Structural commentary
The of the title compound was previously reported by Caputo et al. (1976) at room temperature. The title compound crystallizes in the orthorhombic space group Pnma. The MnII ion occupies an inversion centre and has a distorted octahedral coordination environment comprising four bridging chloride ligands and two mutually trans water molecules (Fig. 1). The two independent Mn—Cl distances are 2.5277 (4) and 2.5845 (4) Å, and the Mn—O distance is 2.1929 (11) Å. Adjacent octahedra share chloride-bridged edges, producing neutral one-dimensional chains parallel to the b axis. The two independent Mn—Cl—Mn bridging angles are 94.982 (19) and 92.269 (19)°. Trimethylammonium cations and non-coordinating chloride anions occupy the regions between the chains. The space group and coordination connectivity are unchanged. The present unit-cell volume of 1030.81 (12) Å3, together with the bond-length data, is consistent with the published room-temperature values.
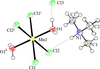 | Figure 1 View of part of the [MnCl2(H2O)2]n chain with one trimethylammoium and one chloride ions, showing 50% probability displacement ellipsoids. Symmetry codes: (i) 1 − x, −  + y, −z + 1, (ii) 1 − x, 1 − y, 1 − z, (iii) x, − y, z. |
The crystal morphology of the title compound was predicted using the Bravais–Friedel–Donnay–Harker (BFDH) model implemented in WinXMorph (Kaminsky, 2005). The predicted morphology exhibits a faceted polyhedral shape, with indexed faces including (100), (010), (210), (011), (101) and (111) (Fig. 2). The BFDH model provides a geometrical prediction of crystal morphology based on lattice parameters and crystal symmetry (Donnay & Harker, 1937). Accordingly, the resulting model illustrates the possible crystal habit without explicitly accounting for surface energetics or the effects of crystallization conditions.
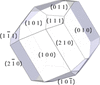 | Figure 2 Calculated crystal-face model of the title compound, showing the Miller indices of the labelled faces. |
3. Supramolecular features
In the crystal packing, parallel neutral {[Mn(μ2-Cl)2(H2O)2]}n chains extend along the b-axis direction, with [(CH3)3NH]+ trimethylammonium cations and free chloride anions (Cl3) occupying the voids between adjacent chains. Both species form hydrogen bonds with the inorganic chains, including O—H⋯Cl and N—H⋯Cl interactions (Table 1). The coordinated water molecules act as hydrogen-bond donors, forming O—H⋯Cl hydrogen bonds with the non-coordinating chloride anions (Cl3). The [(CH3)3NH]+ trimethylammonium cations also serve as hydrogen-bond donors, forming N—H⋯Cl hydrogen bonds with the bridging chloride ligands of the inorganic chains. Hydrogen bonds involving coordinated water molecules and non-coordinating chloride anions were also reported in the room-temperature structure (Caputo et al., 1976).
| ||||||||||||||||||||||
4. Hirshfeld surface analysis
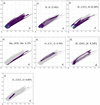
To further investigate the intermolecular contacts involving the trimethylammonium cations, free chloride anions, and the one-dimensional inorganic chain framework, a Hirshfeld surface analysis was undertaken (Fig. 3) and the corresponding two-dimensional fingerprint plots (Fig. 4) were generated for the title compound. The Hirshfeld surface was calculated from the crystallographic information file using Multiwfn (Lu & Chen, 2012) and visualized with VMD (Humphrey et al., 1996). This analysis provides a graphical and quantitative description of the close contacts associated with the selected structural unit in its crystalline environment.
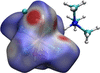 | Figure 3 Hirshfeld surface of the title compound, mapped over dnorm. |
 | Figure 4 Two-dimensional fingerprint plots for the title compound. |
The Hirshfeld surface mapped over the normalized contact distance provides an intuitive visualization of the distribution of intermolecular contacts. Red regions indicate contacts shorter than the sum of the corresponding van der Waals radii, white regions represent contacts with distances close to this sum, and blue regions correspond to longer contacts (Spackman & Jayatilaka, 2009). Prominent red spots are observed in the surface regions associated with the O—H groups of the coordinated water molecules and the N—H group of the trimethylammonium cation. Based on the crystallographic environment, these features can be assigned to the O—H⋯Cl3 contacts involving the free chloride anions and the N—H⋯Cl contacts involving the bridging chloride ligands of the one-dimensional chains, respectively. These surface features are consistent with the hydrogen-bonding contacts identified from the single-crystal structure.
The H⋯Cl/Cl⋯H contacts make the largest contribution to the Hirshfeld surface, accounting for 62.40% of the total surface area, indicating the frequent occurrence of short hydrogen–chloride contacts in the crystal. This observation is consistent with the chloride-rich crystalline environment of the compound and with the crystallographically identified O—H⋯Cl and N—H⋯Cl interactions. H⋯H contacts make the second-largest contribution, accounting for 22.40% of the Hirshfeld surface. Their broad and diffuse distribution in the fingerprint plot is characteristic of relatively non-directional close contacts, including those involving the methyl hydrogen atoms of the trimethylammonium cations. H⋯O/O⋯H contacts contribute 9.34%, whereas H⋯Mn/Mn⋯H, O⋯Cl/Cl⋯O, and O⋯C/C⋯O contacts account for 4.12%, 0.80%, and 0.70%, respectively. These smaller contributions indicate the presence of additional close contacts in the crystalline environment (Hashim et al., 2021). Other contact types make only minor contributions and are not discussed individually.
Overall, the Hirshfeld surface and fingerprint analyses identify H⋯Cl/Cl⋯H as the most prevalent type of surface contact in the title compound. In conjunction with the O—H⋯Cl and N—H⋯Cl geometries determined crystallographically, these results support the importance of chloride-associated hydrogen-bonding contacts in the organization and consolidation of the crystal packing. However, the Hirshfeld surface percentages represent contact-area contributions and should not be interpreted directly as relative interaction energies or as independent evidence for the dimensionality of the supramolecular assembly.
5. Density functional theory calculations
To gain further insight into the electronic structure and vibrational properties of the title compound, periodic spin-polarized density functional theory calculations were performed using CASTEP (Clark et al., 2005) within the collinear spin formalism. The Perdew–Burke–Ernzerhof (PBE) exchange–correlation functional was employed together with the Tkatchenko–Scheffler dispersion correction. A Hubbard correction of U = 2.5 eV was applied to the Mn 3d orbitals. Norm-conserving pseudopotentials and a plane-wave energy cutoff of 750 eV were used. Brillouin-zone sampling employed a 1 × 1 × 1 Monkhorst–Pack k-point grid (Monkhorst & Pack, 1976). The self-consistent-field (SCF) energy convergence threshold was set to 2.0 × 10⁻⁶ eV per atom, and a density mixing scheme was used for electronic minimization. The experimentally determined was used as the starting model for geometry optimization, and the optimized structure was subsequently used for single-point electronic-structure calculations.
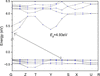
The calculated electronic band structure along the high-symmetry path G–Z–T–Y–S–X–U–R is shown in Fig. 5. At the PBE+U level of theory, the compound exhibits a wide band gap (Eg = 4.93 eV). Both the valence and conduction bands are remarkably flat across the entire reflecting the weak interchain electronic coupling and highly localized character of the frontier electronic states, which is consistent with a molecular ionic crystal dominated by electrostatic and hydrogen-bonding interactions. Notably, the flat band feature does not mean complete electronic isolation of MnII centres along the chain: superexchange interactions between adjacent MnII ions can still be mediated by the bridging chloride ligands, as widely demonstrated by magnetic studies on the isostructural [(CH3)3NH]·MnCl3·(H2O)2 family (Bhatia et al., 1976) .
 | Figure 5 The band structure of the title compound. |
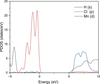
The partial (PDOS, Fig. 6) reveals that the upper valence band (−5 to 0 eV) is dominated by Cl 3p states, while the shows mixed s, p and minor Mn 3d contributions.
 | Figure 6 Partial density of states of the title compound. |
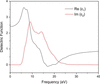
The calculated complex dielectric function of the title compound for [100] polarization is presented in Fig. 7. The imaginary part ɛ2(ω), which is directly related to the optical absorption probability, shows an absorption onset at approximately 5.0 eV, consistent with the wide-band-gap insulating character derived from the band structure calculation. The strongest absorption peak centred at ca. 8.7 eV is assigned to ligand-to-metal charge transfer (LMCT) transitions from the Cl 3p-dominated upper valence band to Mn 3d states in the in full agreement with the partial analysis.
 | Figure 7 Calculated complex dielectric function of the title compound. |
The real part ɛ1(ω) displays typical normal dispersion in the transparent region below the absorption edge, with a static dielectric constant ɛ1(0) at the zero-frequency limit. This moderate value reflects the molecular ionic nature of the crystal, where electronic polarization is largely localized within the one-dimensional Mn–Cl chains and discrete organic cations, with only minor contributions from weak interchain hydrogen-bonding and van der Waals interactions. Across the main absorption band, ɛ1(ω) undergoes anomalous dispersion, decreases sharply through zero and reaches a minimum near 16 eV before slowly recovering toward unity at higher energies.
Fig. 8 shows the real and imaginary components of the optical conductivity for three polarization directions. The real component becomes appreciable around 5 eV and exhibits its strongest peaks at approximately 13.6–14.9 eV, while the imaginary component displays a dispersive response with sign changes around 12–14 eV. Near 8.5 eV, the [010] response is approximately 2.40 times that for [001], indicating enhanced coupling to light polarized along the coordination chains. However, the dominant polarization varies with photon energy, showing that the chain-like structure does not produce a uniformly chain-dominated optical response. These results identify a polarization-sensitive ultraviolet region for future experimental investigation.
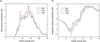 | Figure 8 Optical conductivity for three polarizations. |
The simulated Raman spectrum in the range 1000–3500 cm−1 is shown in Fig. 9. The most intense peaks at 2950-3050 cm−1 are assigned to the C—H stretching vibrations of the trimethylammonium methyl groups (Libowitzky, 1999). Of particular interest is the pair of peaks in the 3200–3400 cm−1 region, which is attributed to the O—H stretching of coordinated water and the N—H stretching of the trimethylammonium cation (Lin et al., 2020). The positions of these peaks are consistent with the involvement of O—H and N—H groups in hydrogen bonding with chloride acceptors: the O—H stretches appear at frequencies moderately red-shifted relative to free water, in accord with the O—H⋯Cl hydrogen bonds (O⋯Cl = 3.1479 Å) identified crystallographically, and the N—H stretch likewise reflects the N—H⋯Cl interaction (N⋯Cl = 3.3685 Å). These spectroscopic features provide independent computational support for the hydrogen-bonding network described in the supramolecular analysis. Weak features around 1450–1500 cm−1 correspond to C—H bending modes (Snyder et al., 1978).
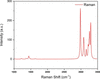 | Figure 9 Simulated Raman spectrum. |
6. Synthesis and crystallization
MnCl2·4H2O and (CH3)3NHCl were dissolved in deionized water in a 1:1 molar ratio. A small amount of hydrochloric acid was added to maintain a weakly acidic environment. The mixture was stirred until homogeneous, and the resulting clear solution was left to stand in an open vessel at room temperature. Pale-pink block-shaped crystals suitable for single-crystal X-ray diffraction were obtained by slow evaporation over several days.
7. Refinement
Crystal data, data collection and structure details are summarized in Table 2. H atoms bonded to carbon atoms were placed in calculated positions and refined as riding atoms, with C—H = 0.98 Å and Uiso(H) = 1.5Ueq(C) for the methyl groups. The H atom attached to N was also included in a calculated position and refined using a riding model, with Uiso(H) = 1.2Ueq(N). The H atoms of the coordinated water molecule were included in the refinement using constrained positions, with Uiso(H) = 1.5Ueq(O).
|
Supporting information
CCDC reference: 2548320
contains datablock I. DOI: https://doi.org/10.1107/S2056989026010765/oo2019sup1.cif
Structure factors: contains datablock I. DOI: https://doi.org/10.1107/S2056989026010765/oo2019Isup2.hkl
Supporting information file. DOI: https://doi.org/10.1107/S2056989026010765/oo2019Isup3.mol
| (C3H10N)[MnCl2(HO2)2]Cl | Dx = 1.659 Mg m−3 |
| Mr = 257.44 | Mo Kα radiation, λ = 0.71073 Å |
| Orthorhombic, Pnma | Cell parameters from 2016 reflections |
| a = 16.7931 (12) Å | θ = 2.4–30.0° |
| b = 7.4533 (5) Å | µ = 2.01 mm−1 |
| c = 8.2357 (5) Å | T = 100 K |
| V = 1030.81 (12) Å3 | Block, pink |
| Z = 4 | 0.36 × 0.32 × 0.14 mm |
| F(000) = 524 |
| XtaLAB Mini II diffractometer | Rint = 0.030 |
| ω scans | θmax = 30.3°, θmin = 2.4° |
| Absorption correction: multi-scan (CrysAlis PRO; Rigaku OD, 2018) | h = −18→23 |
| Tmin = 0.630, Tmax = 1.000 | k = −10→10 |
| 6414 measured reflections | l = −11→11 |
| 1594 independent reflections | 3 standard reflections every 150 reflections |
| 1227 reflections with I > 2σ(I) | intensity decay: 0.4% |
| Refinement on F2 | 0 restraints |
| Least-squares matrix: full | Hydrogen site location: mixed |
| R[F2 > 2σ(F2)] = 0.029 | H-atom parameters constrained |
| wR(F2) = 0.072 | w = 1/[σ2(Fo2) + (0.0349P)2] where P = (Fo2 + 2Fc2)/3 |
| S = 1.03 | (Δ/σ)max = 0.001 |
| 1594 reflections | Δρmax = 0.32 e Å−3 |
| 57 parameters | Δρmin = −0.38 e Å−3 |
Geometry. All esds (except the esd in the dihedral angle between two l.s. planes) are estimated using the full covariance matrix. The cell esds are taken into account individually in the estimation of esds in distances, angles and torsion angles; correlations between esds in cell parameters are only used when they are defined by crystal symmetry. An approximate (isotropic) treatment of cell esds is used for estimating esds involving l.s. planes. |
| x | y | z | Uiso*/Ueq | Occ. (<1) | |
| Mn1 | 0.500000 | 0.500000 | 0.500000 | 0.02283 (11) | |
| Cl1 | 0.60171 (3) | 0.250000 | 0.50062 (7) | 0.02673 (14) | |
| Cl2 | 0.39811 (3) | 0.250000 | 0.56421 (8) | 0.02891 (14) | |
| Cl3 | 0.41077 (4) | 0.750000 | −0.00188 (7) | 0.03204 (16) | |
| O1 | 0.47692 (8) | 0.46220 (16) | 0.24016 (14) | 0.0304 (3) | |
| H1D | 0.514500 | 0.416176 | 0.184671 | 0.046* | |
| H1E | 0.467192 | 0.561761 | 0.193600 | 0.046* | |
| N1 | 0.31714 (12) | 0.250000 | 0.1900 (2) | 0.0308 (5) | |
| H1 | 0.370071 | 0.250002 | 0.245686 | 0.037* | |
| C2 | 0.33240 (18) | 0.250000 | 0.0103 (3) | 0.0423 (7) | |
| H2A | 0.363974 | 0.352680 | −0.018105 | 0.064* | 0.5 |
| H2B | 0.282514 | 0.254810 | −0.046415 | 0.064* | 0.5 |
| H2C | 0.360334 | 0.142510 | −0.019375 | 0.064* | 0.5 |
| C1 | 0.27415 (12) | 0.0848 (3) | 0.2417 (2) | 0.0431 (5) | |
| H1A | 0.221696 | 0.081149 | 0.189685 | 0.065* | |
| H1B | 0.267563 | 0.085600 | 0.359966 | 0.065* | |
| H1C | 0.304908 | −0.021171 | 0.209555 | 0.065* |
| U11 | U22 | U33 | U12 | U13 | U23 | |
| Mn1 | 0.0267 (2) | 0.01811 (19) | 0.02363 (18) | 0.00153 (14) | −0.00167 (14) | −0.00124 (13) |
| Cl1 | 0.0216 (3) | 0.0195 (3) | 0.0391 (3) | 0.000 | 0.0022 (2) | 0.000 |
| Cl2 | 0.0261 (3) | 0.0238 (3) | 0.0369 (3) | 0.000 | 0.0035 (2) | 0.000 |
| Cl3 | 0.0399 (3) | 0.0291 (3) | 0.0272 (3) | 0.000 | 0.0019 (2) | 0.000 |
| O1 | 0.0400 (7) | 0.0259 (6) | 0.0252 (6) | 0.0060 (6) | 0.0004 (5) | 0.0000 (5) |
| N1 | 0.0249 (10) | 0.0309 (11) | 0.0366 (11) | 0.000 | −0.0078 (9) | 0.000 |
| C2 | 0.0428 (17) | 0.0442 (17) | 0.0401 (15) | 0.000 | −0.0005 (12) | 0.000 |
| C1 | 0.0383 (11) | 0.0367 (11) | 0.0542 (12) | −0.0047 (9) | −0.0053 (9) | 0.0116 (9) |
| Mn1—Cl1i | 2.5276 (4) | N1—C2 | 1.502 (3) |
| Mn1—Cl1 | 2.5277 (4) | N1—C1ii | 1.490 (2) |
| Mn1—Cl2 | 2.5845 (4) | N1—C1 | 1.490 (2) |
| Mn1—Cl2i | 2.5845 (4) | C2—H2A | 0.9600 |
| Mn1—O1 | 2.1929 (11) | C2—H2B | 0.9601 |
| Mn1—O1i | 2.1930 (11) | C2—H2C | 0.9601 |
| O1—H1D | 0.8513 | C1—H1A | 0.9800 |
| O1—H1E | 0.8511 | C1—H1B | 0.9800 |
| N1—H1 | 1.0000 | C1—H1C | 0.9800 |
| Cl1i—Mn1—Cl1 | 180.0 | H1D—O1—H1E | 104.6 |
| Cl1i—Mn1—Cl2i | 85.151 (15) | C2—N1—H1 | 107.4 |
| Cl1—Mn1—Cl2i | 94.849 (15) | C1ii—N1—H1 | 107.4 |
| Cl1—Mn1—Cl2 | 85.151 (15) | C1—N1—H1 | 107.4 |
| Cl1i—Mn1—Cl2 | 94.849 (15) | C1ii—N1—C2 | 111.36 (13) |
| Cl2—Mn1—Cl2i | 180.0 | C1—N1—C2 | 111.36 (13) |
| O1i—Mn1—Cl1i | 91.53 (3) | C1—N1—C1ii | 111.5 (2) |
| O1—Mn1—Cl1 | 91.53 (3) | N1—C2—H2A | 109.6 |
| O1i—Mn1—Cl1 | 88.47 (3) | N1—C2—H2B | 109.3 |
| O1—Mn1—Cl1i | 88.47 (3) | N1—C2—H2C | 109.5 |
| O1i—Mn1—Cl2 | 90.57 (4) | H2A—C2—H2B | 109.5 |
| O1—Mn1—Cl2 | 89.43 (4) | H2A—C2—H2C | 109.5 |
| O1—Mn1—Cl2i | 90.57 (4) | H2B—C2—H2C | 109.5 |
| O1i—Mn1—Cl2i | 89.43 (4) | N1—C1—H1A | 109.5 |
| O1—Mn1—O1i | 180.0 | N1—C1—H1B | 109.5 |
| Mn1iii—Cl1—Mn1 | 94.982 (19) | N1—C1—H1C | 109.5 |
| Mn1—Cl2—Mn1iii | 92.269 (19) | H1A—C1—H1B | 109.5 |
| Mn1—O1—H1D | 116.4 | H1A—C1—H1C | 109.5 |
| Mn1—O1—H1E | 111.2 | H1B—C1—H1C | 109.5 |
| Symmetry codes: (i) −x+1, −y+1, −z+1; (ii) x, −y+1/2, z; (iii) −x+1, y−1/2, −z+1. |
| D—H···A | D—H | H···A | D···A | D—H···A |
| N1—H1···Cl2 | 1.00 (2) | 2.67 (1) | 3.3685 (19) | 128 (1) |
| O1—H1D···Cl3 | 0.85 (1) | 2.32 (1) | 3.1479 (14) | 165 (1) |
Acknowledgements
The authors thank Professor Hongling Cai from Nanjing University for providing the single-crystal diffractometer used in this work.
Funding information
Funding for this research was provided by: Natural Science Foundation of Shandong Province (grant No. ZR2023QA144 to Zhangran Gao); Natural Science Foundation of Fujian Province (grant No. 2025J08229 to Zhangran Gao); Scientific Research Launch Foundation of Fujian University of Technology (grant No. GY-Z24040 to Zhangran Gao).
References
 Bhatia, S. N., O'Connor, C. J. & Carlin, R. L. (1976). Inorg. Chem. 15, 2900–2904. CrossRef CAS Google Scholar
Caputo, R. E., Willett, R. D. & Muir, J. A. (1976). Acta Cryst. B32, 2639–2642. CrossRef CAS IUCr Journals Web of Science Google Scholar
Clark, S. J., Segall, M. D., Pickard, C. J., Hasnip, P. J., Probert, M. J., Refson, K. & Payne, M. C. (2005). Z. Kristallogr. 220, 567–570. Web of Science CrossRef CAS Google Scholar
Dolomanov, O. V., Bourhis, L. J., Gildea, R. J., Howard, J. A. K. & Puschmann, H. (2009). J. Appl. Cryst. 42, 339–341. Web of Science CrossRef CAS IUCr Journals Google Scholar
Donnay, J. D. H. & Harker, D. (1937). Am. Mineral. 22, 446–467. CAS Google Scholar
Hashim, K. K. M., Manoj, E. & Kurup, M. R. P. (2021). J. Mol. Struct. 1246, 131125. CrossRef PubMed Google Scholar
Humphrey, W., Dalke, A. & Schulten, K. (1996). J. Mol. Graph. 14, 33–38. CrossRef CAS PubMed Web of Science Google Scholar
Kaminsky, W. (2005). J. Appl. Cryst. 38, 566–567. Web of Science CrossRef CAS IUCr Journals Google Scholar
Libowitzky, E. (1999). Monatsh. Chem. 130, 1047–1059. Web of Science CrossRef CAS Google Scholar
Lin, C.-K., Shishido, R., Huang, Q.-R., Fujii, A. & Kuo, J.-L. (2020). Phys. Chem. Chem. Phys. 22, 22035–22046. CrossRef CAS PubMed Google Scholar
Lu, T. & Chen, F. (2012). J. Comput. Chem. 33, 580–592. Web of Science CrossRef PubMed Google Scholar
Monkhorst, H. J. & Pack, J. D. (1976). Phys. Rev. B 13, 5188–5192. CrossRef Web of Science Google Scholar
Rigaku OD (2018). CrysAlis PRO including ABSPACK. Rigaku Oxford Diffraction, Yarnton, England. Google Scholar
Sheldrick, G. M. (2015a). Acta Cryst. A71, 3–8. Web of Science CrossRef IUCr Journals Google Scholar
Sheldrick, G. M. (2015b). Acta Cryst. C71, 3–8. Web of Science CrossRef IUCr Journals Google Scholar
Snyder, R., Hsu, S. & Krimm, S. (1978). Spectrochim. Acta A 34, 395–406. CrossRef Google Scholar
Spackman, M. A. & Jayatilaka, D. (2009). CrystEngComm 11, 19–32. Web of Science CrossRef CAS Google Scholar
This is an open-access article distributed under the terms of the Creative Commons Attribution (CC-BY) Licence, which permits unrestricted use, distribution, and reproduction in any medium, provided the original authors and source are cited.
| CRYSTALLOGRAPHIC COMMUNICATIONS |
access