
Acta Crystallographica Section E
Acta Crystallographica
Section E CRYSTALLOGRAPHIC COMMUNICATIONS
Acta Crystallographica
Section E CRYSTALLOGRAPHIC COMMUNICATIONS


 menu
|
|
Figure 6
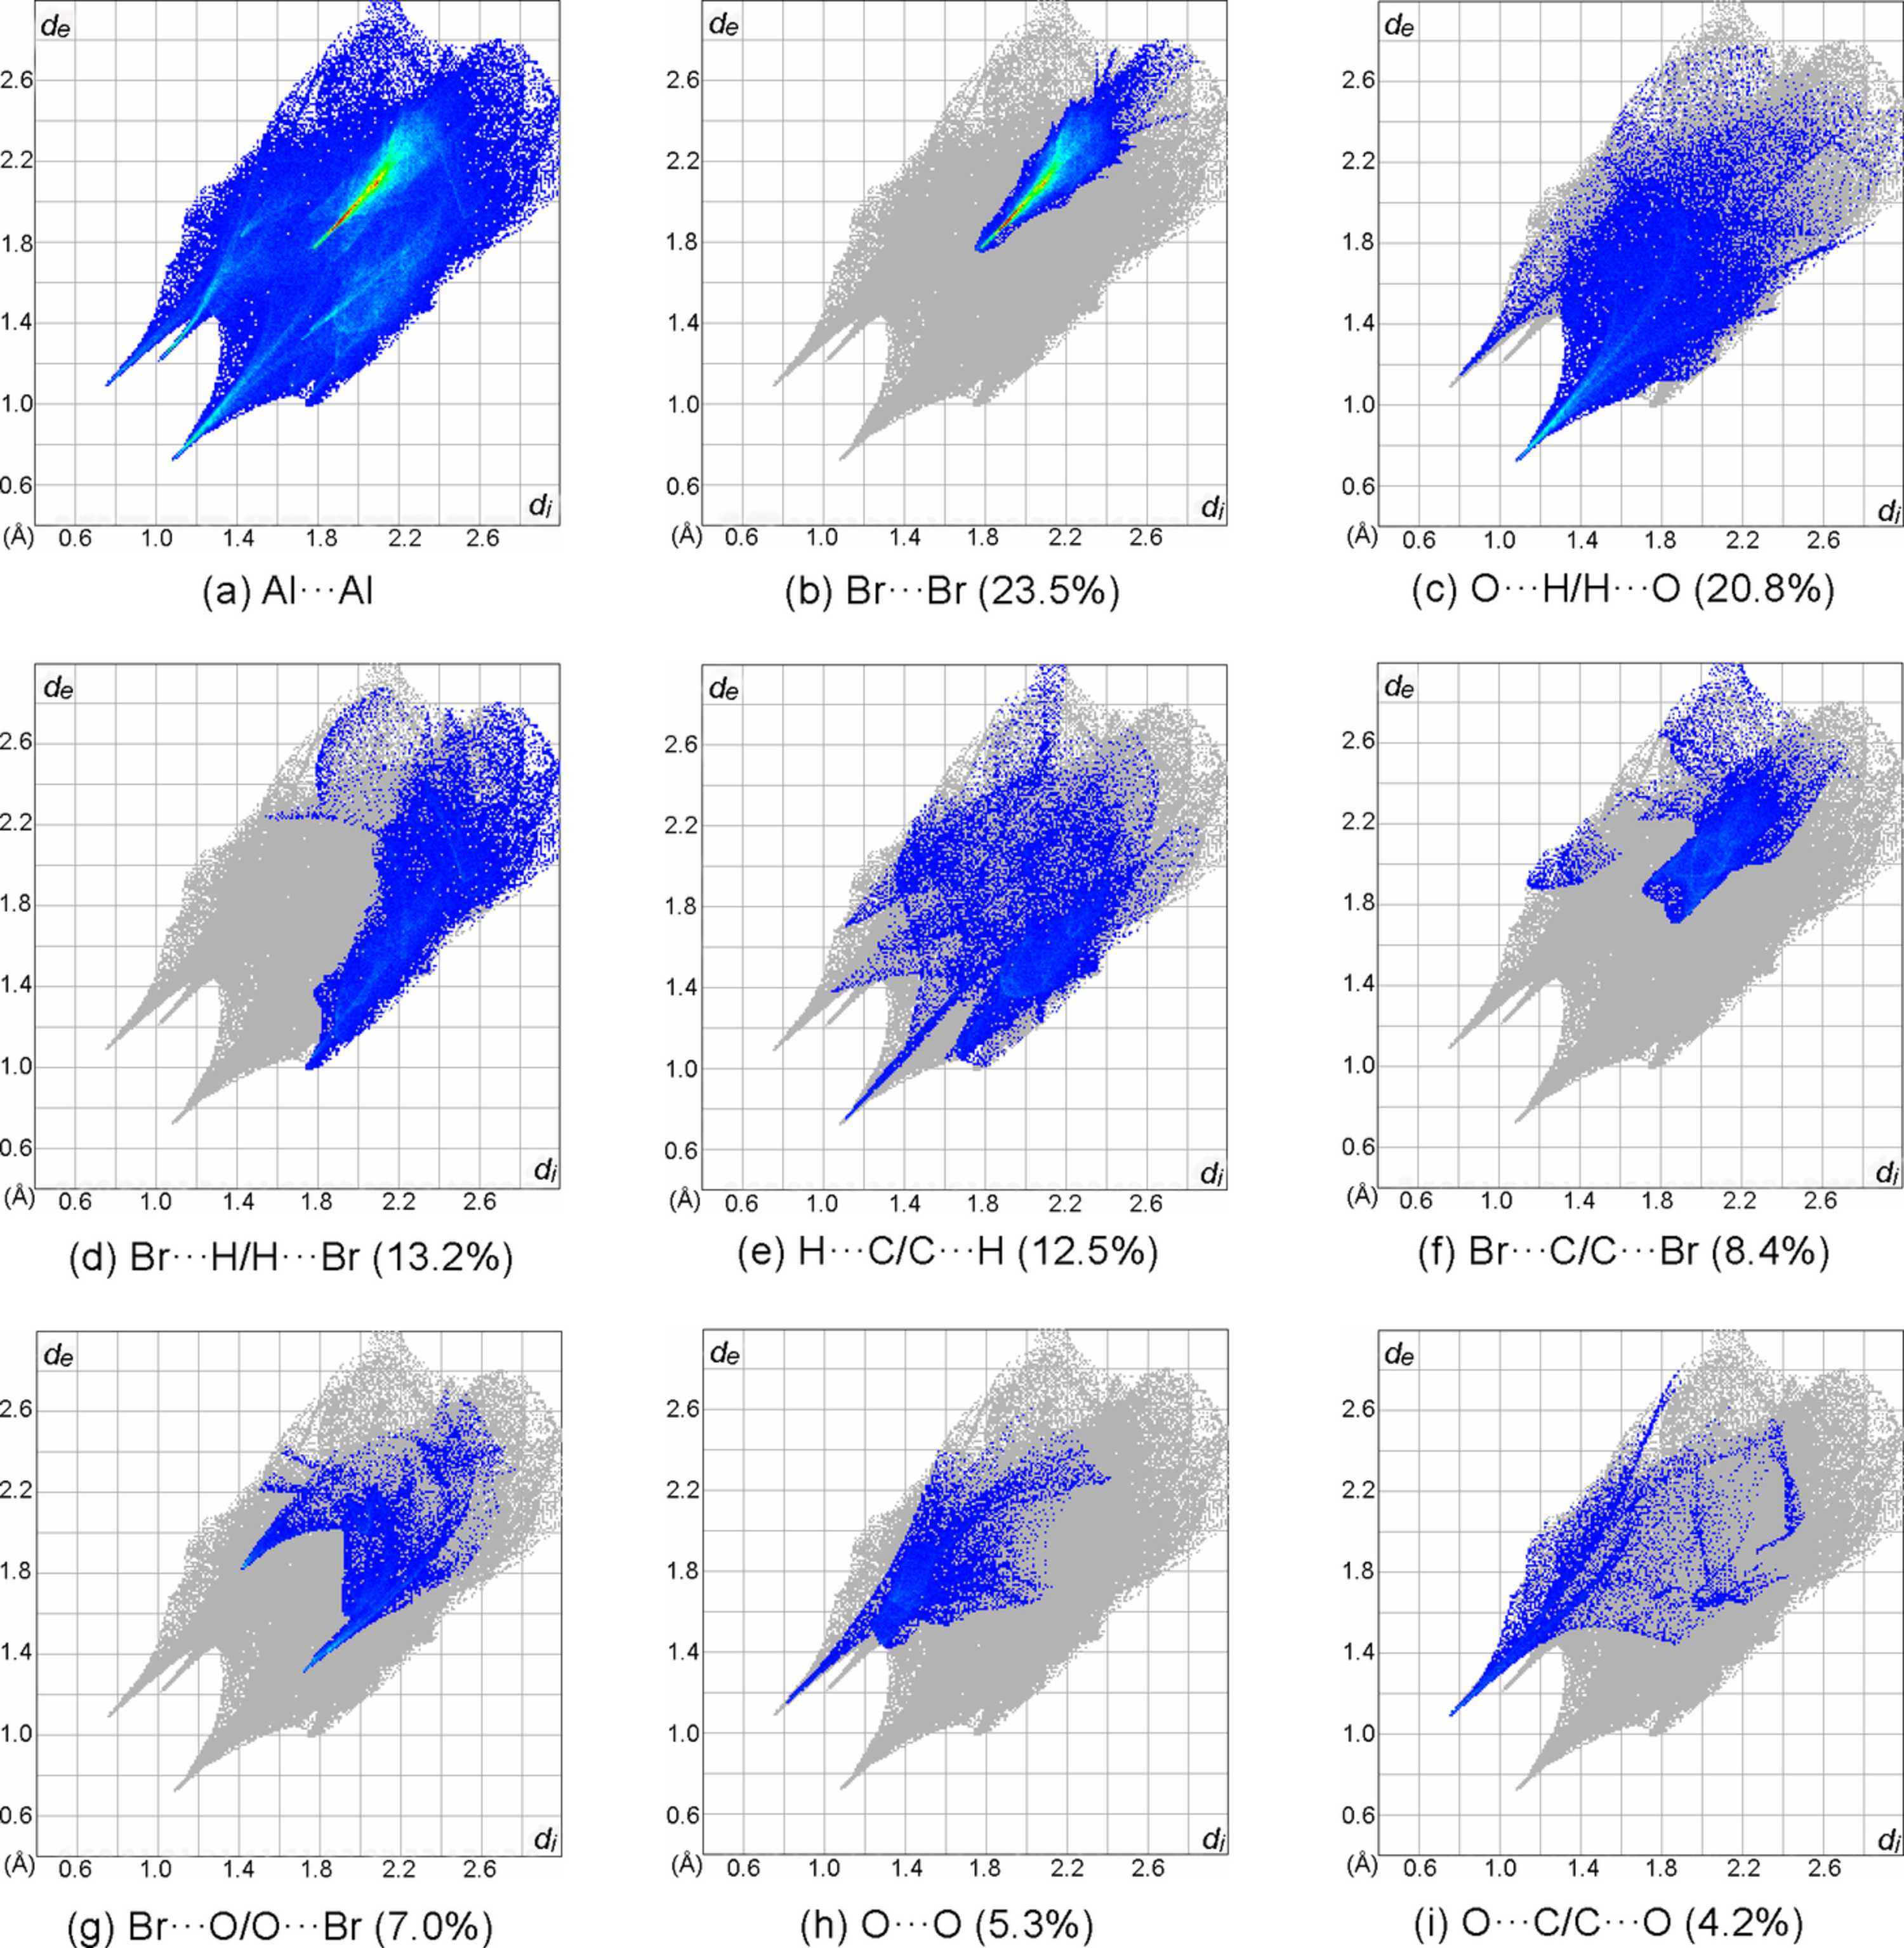
The two-dimensional fingerprint plots for 1, showing (a) all interactions, and those delineated into (b) Br⋯Br, (c) O⋯H/H⋯O, (d) Br⋯H/H⋯Br, (e) H⋯C/C⋯H, (f) Br⋯C/C⋯Br, (g) Br⋯O/O⋯Br, (h) O⋯O, and (i) O⋯C/C⋯O interactions. The de and di values represent the closest external and internal distances (Å), respectively, from a given point on the Hirshfeld surface. |
| CRYSTALLOGRAPHIC COMMUNICATIONS |
ISSN: 2056-9890
Open  access