
Acta Crystallographica Section F
Acta Crystallographica
Section F STRUCTURAL BIOLOGY COMMUNICATIONS
Acta Crystallographica
Section F STRUCTURAL BIOLOGY COMMUNICATIONS


 menu
|
|
Figure 1
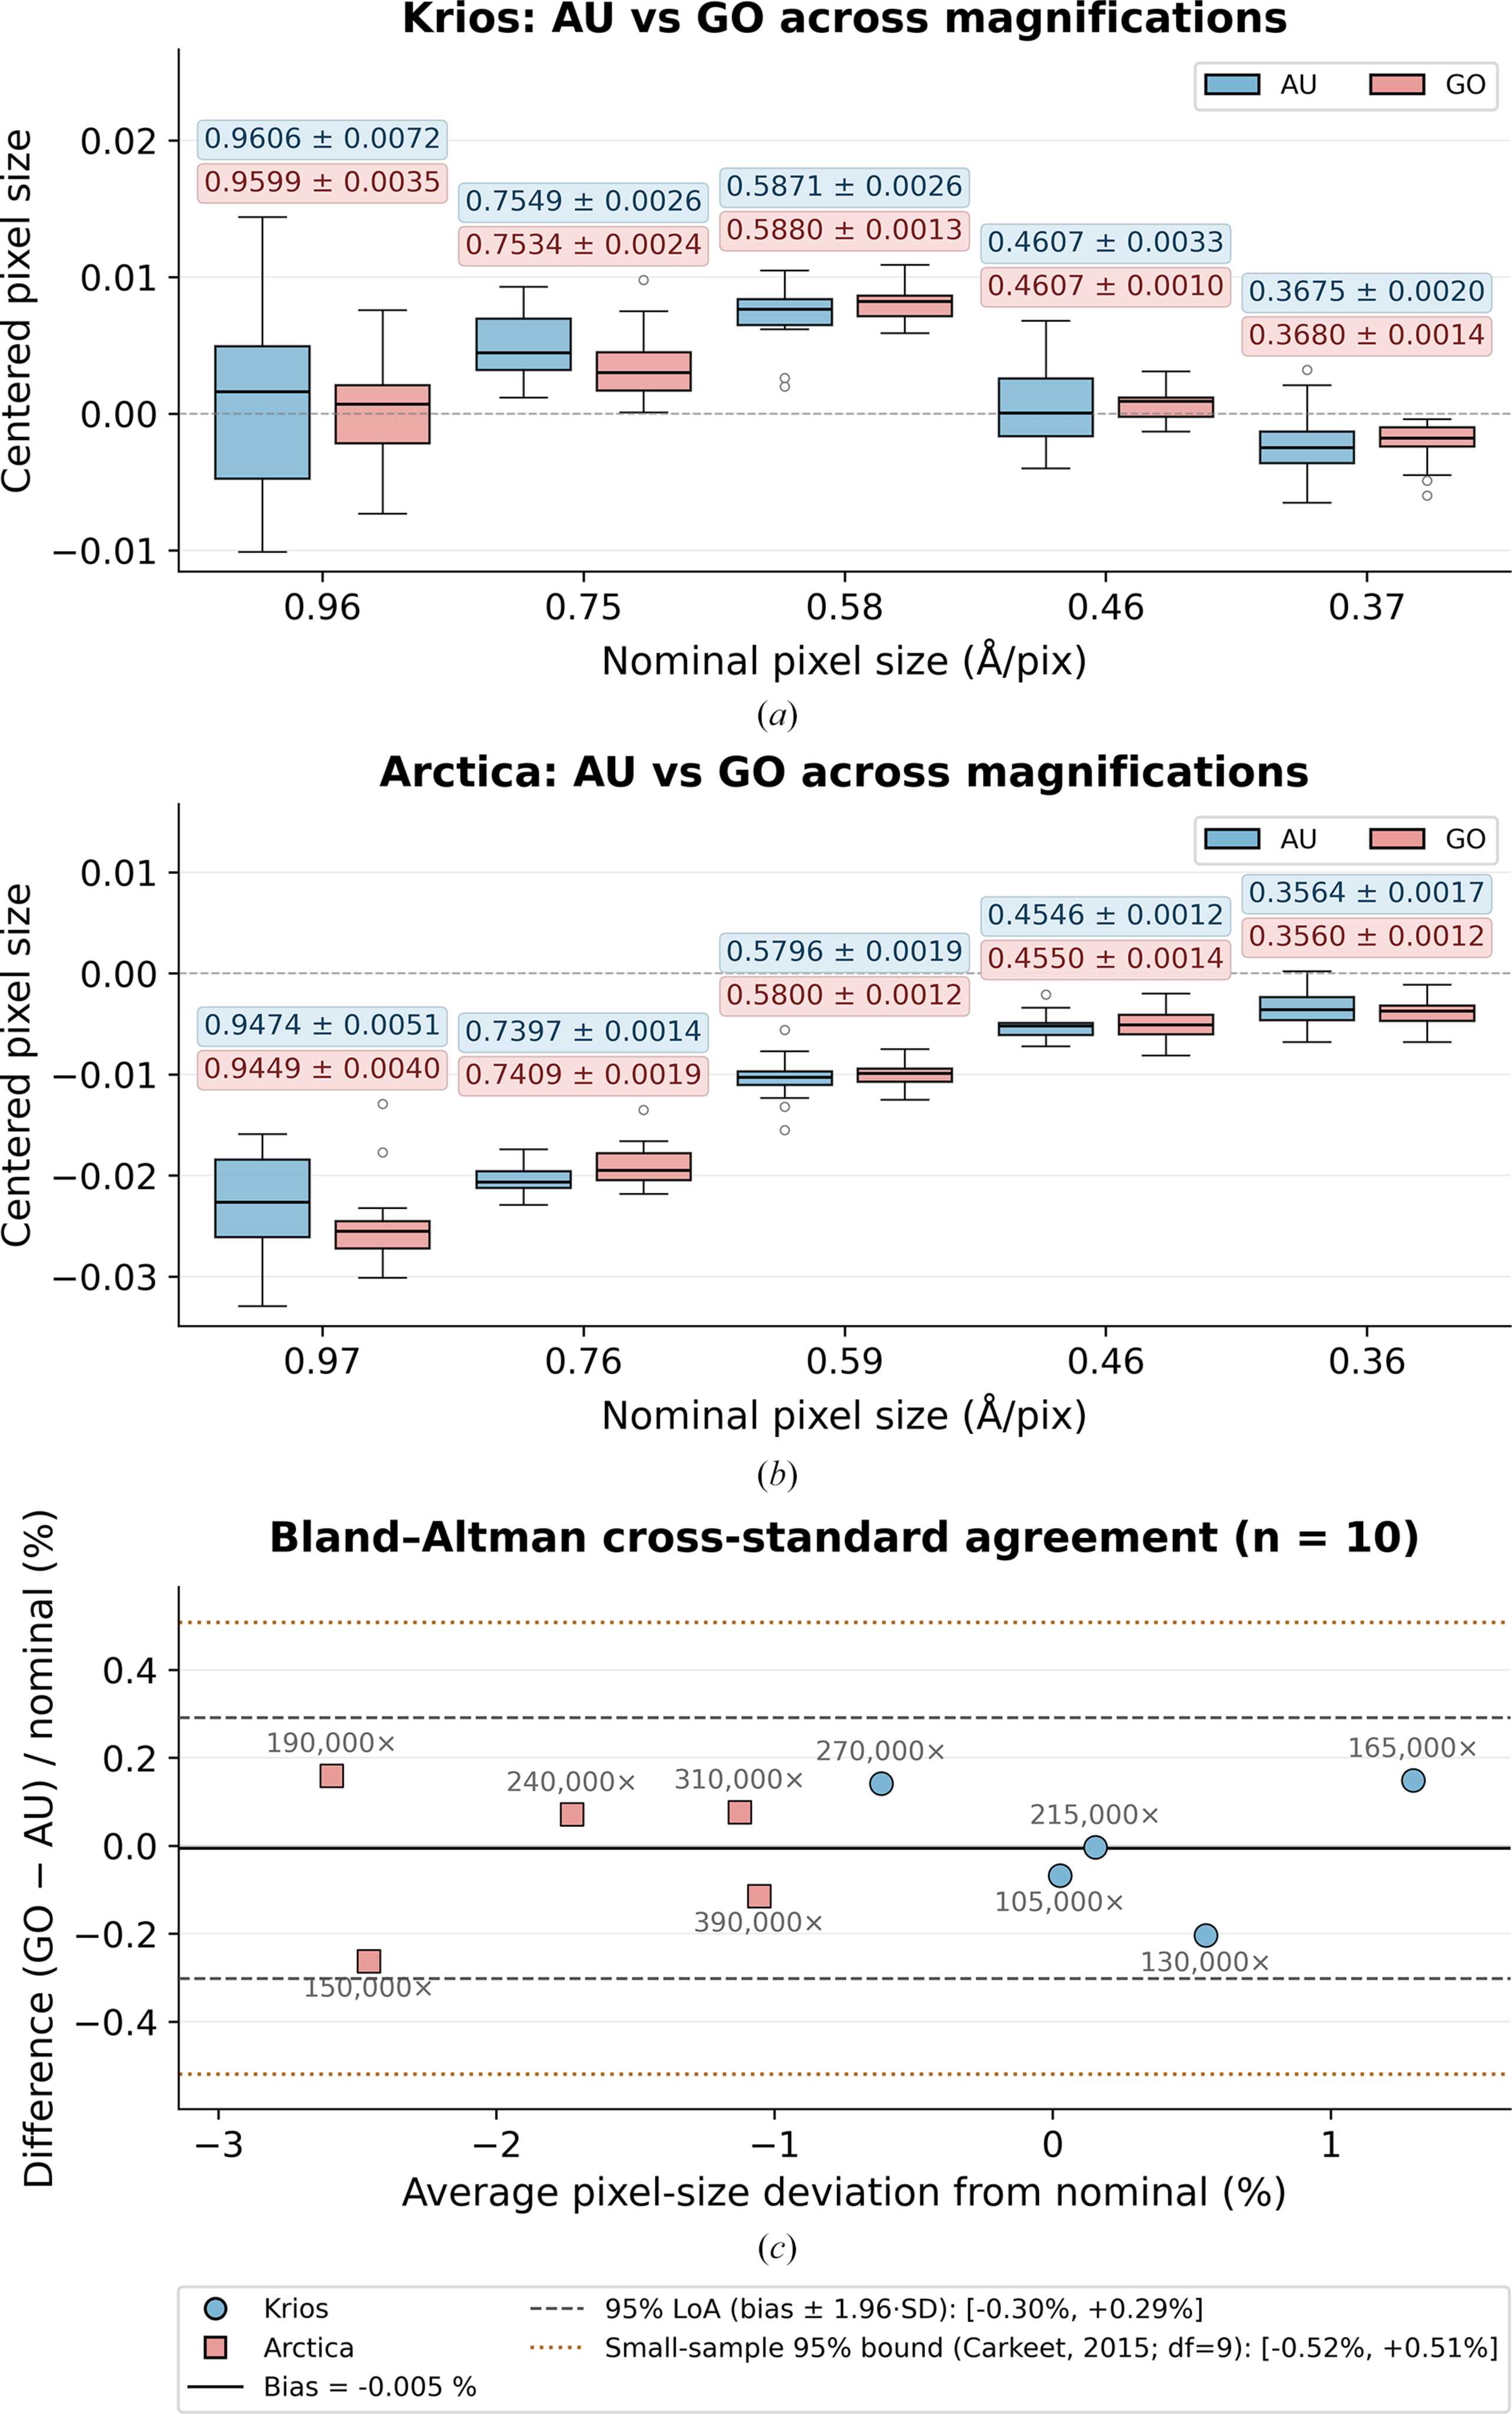
Centered pixel-size distributions by nominal magnification and specimen type. Box plots show the distribution of calibrated pixel sizes (after subtracting the nominal value; dashed line) for gold (blue) and GO (red) across five magnification settings on (a) Titan Krios G3 and (b) Talos Arctica G2 microscopes. (c) Bland–Altman comparison of GO and gold calibrations expressed as percentage of nominal. Bias is −0.005% of nominal; 95% LoA are [−0.30%, +0.29%]. |
| STRUCTURAL BIOLOGY COMMUNICATIONS |
ISSN: 2053-230X
 access