
Acta Crystallographica Section F
Acta Crystallographica
Section F STRUCTURAL BIOLOGY COMMUNICATIONS
Acta Crystallographica
Section F STRUCTURAL BIOLOGY COMMUNICATIONS


 menu
|
|
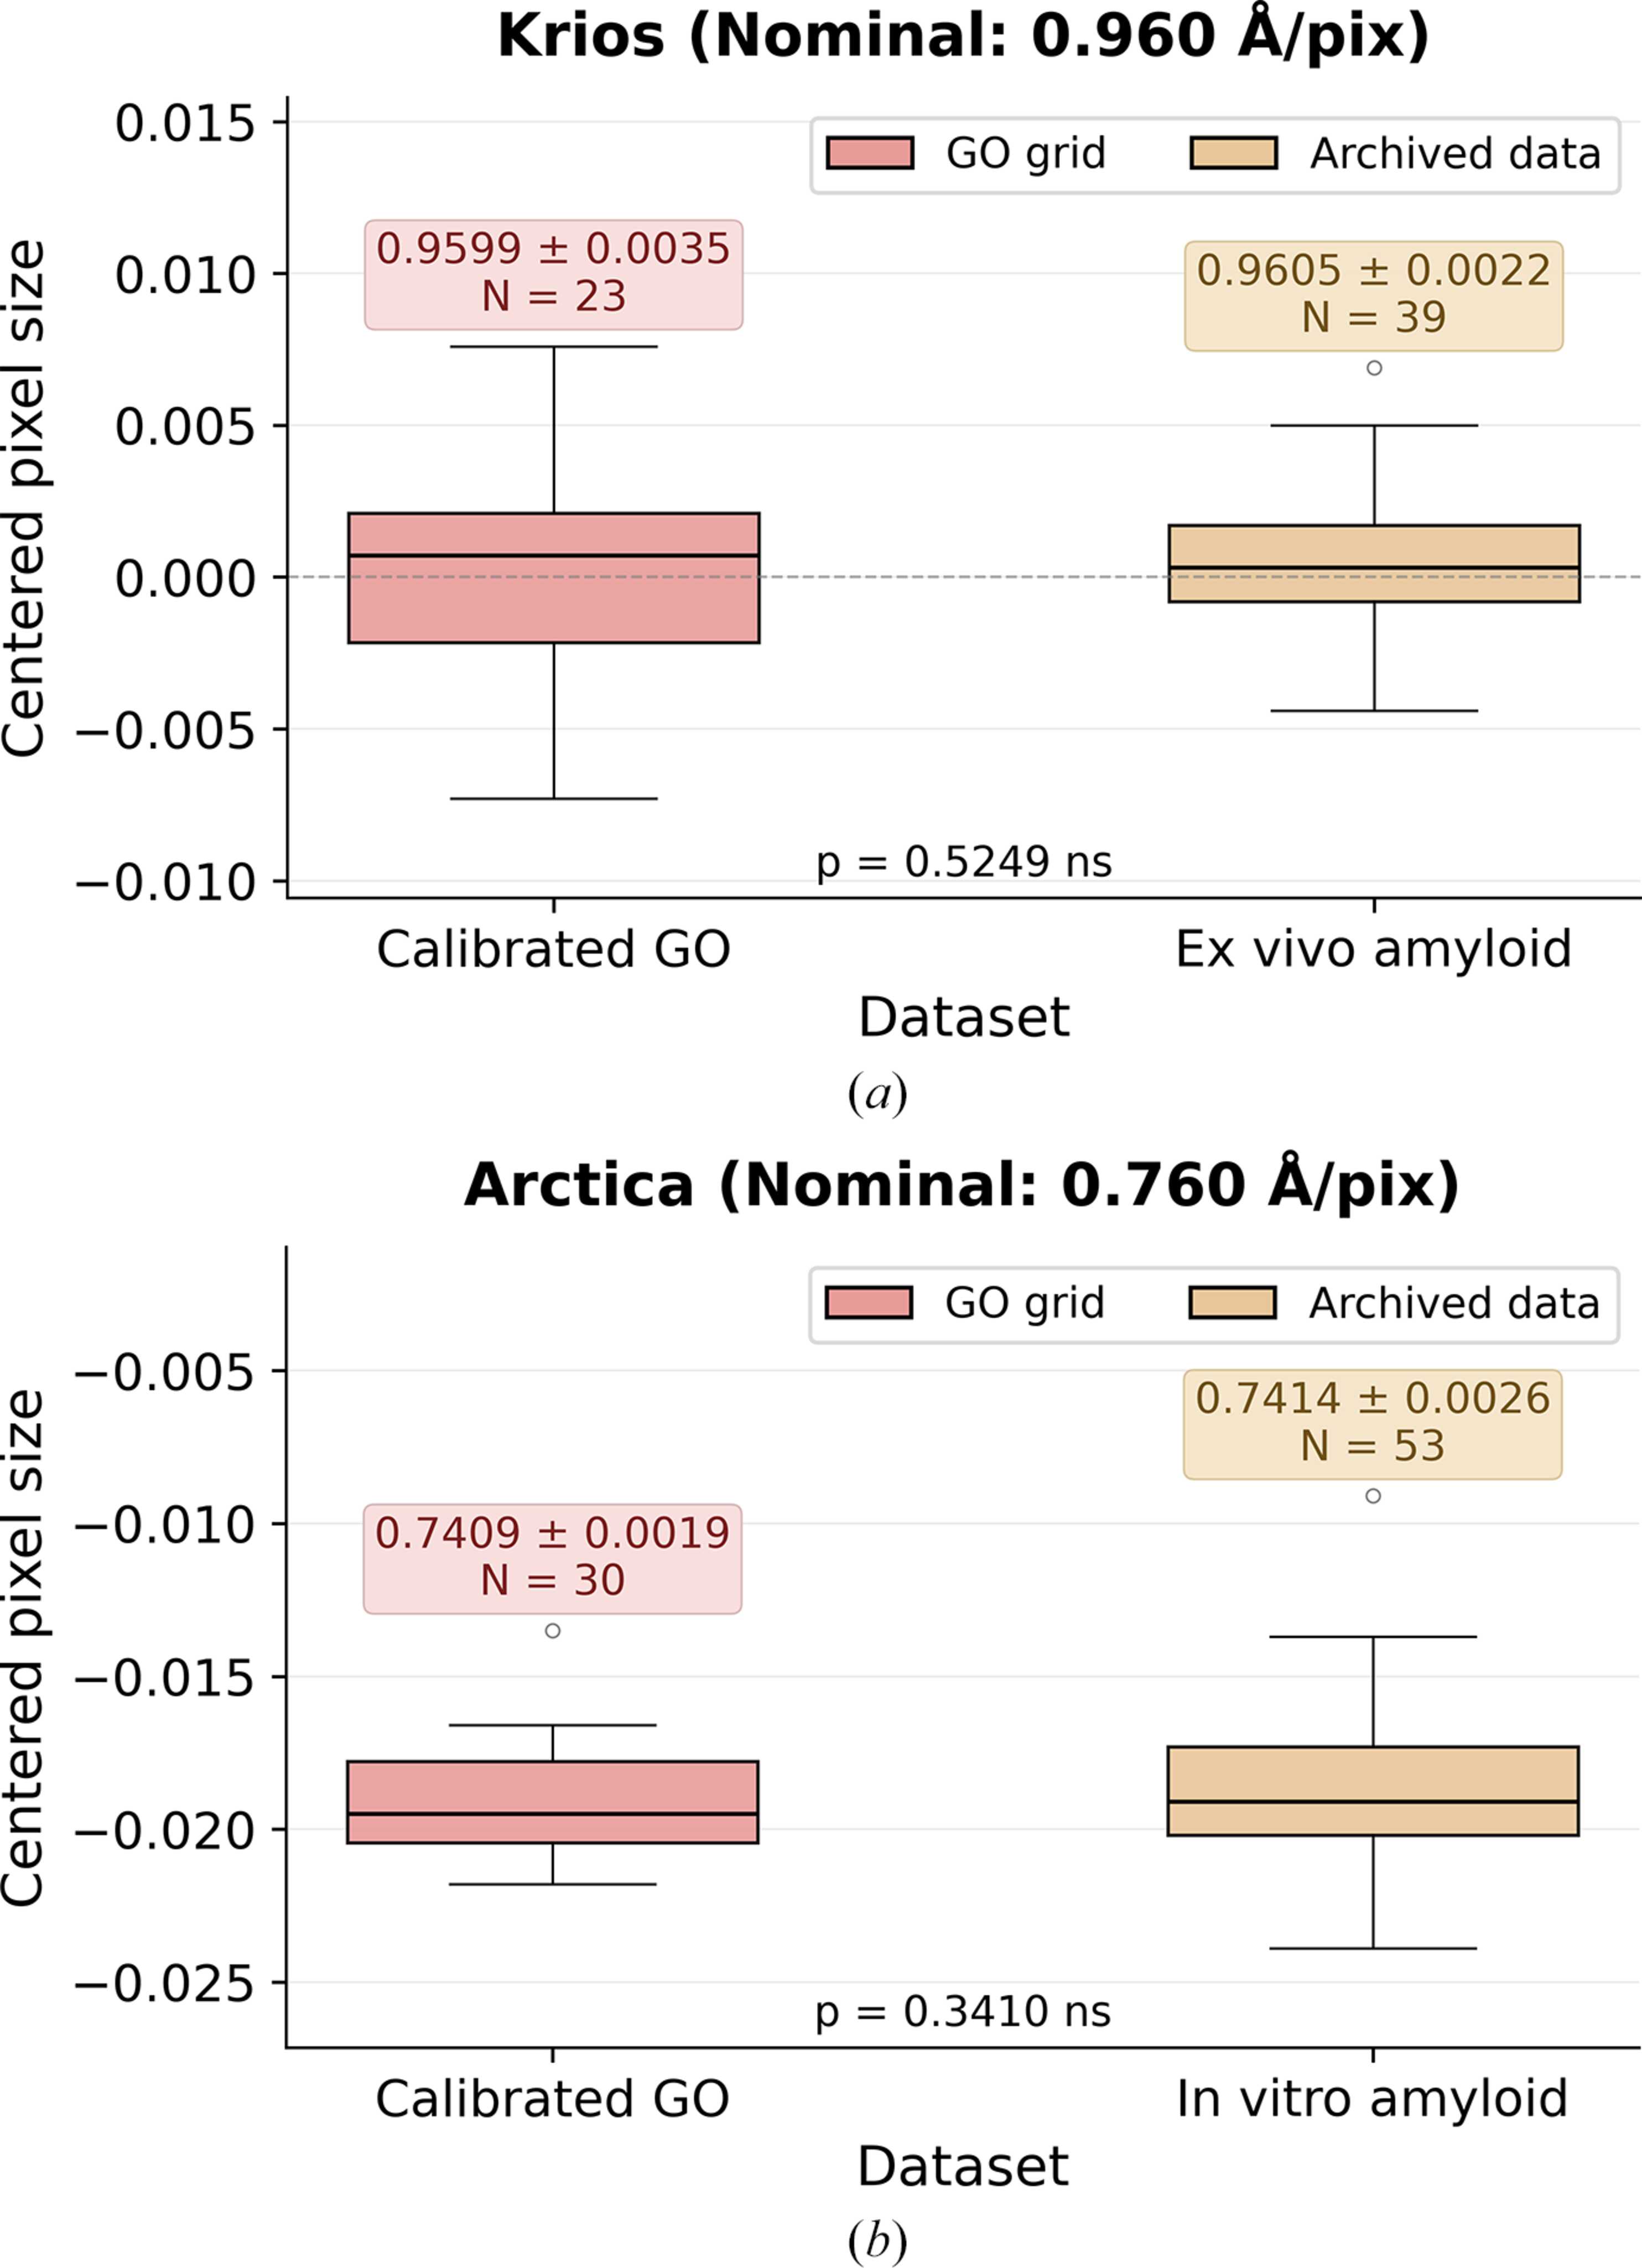
Figure 2
Retrospective per-region calibration on archived amyloid-β fibril datasets compared with calibrations from dedicated test micrographs at matching magnification settings. (a) Titan Krios G3 at 105 000× (nominal 0.96 Å per pixel): new GO calibration versus the ex vivo amyloid dataset. (b) Talos Arctica G2 at 190 000× (nominal 0.76 Å per pixel): new GO calibration versus the in vitro amyloid dataset. p-values are from independent-samples t-tests on the centered pixel-size distributions. |
| STRUCTURAL BIOLOGY COMMUNICATIONS |
ISSN: 2053-230X
 access