
Acta Crystallographica Section F
Acta Crystallographica
Section F STRUCTURAL BIOLOGY COMMUNICATIONS
Acta Crystallographica
Section F STRUCTURAL BIOLOGY COMMUNICATIONS


 menu
|
|
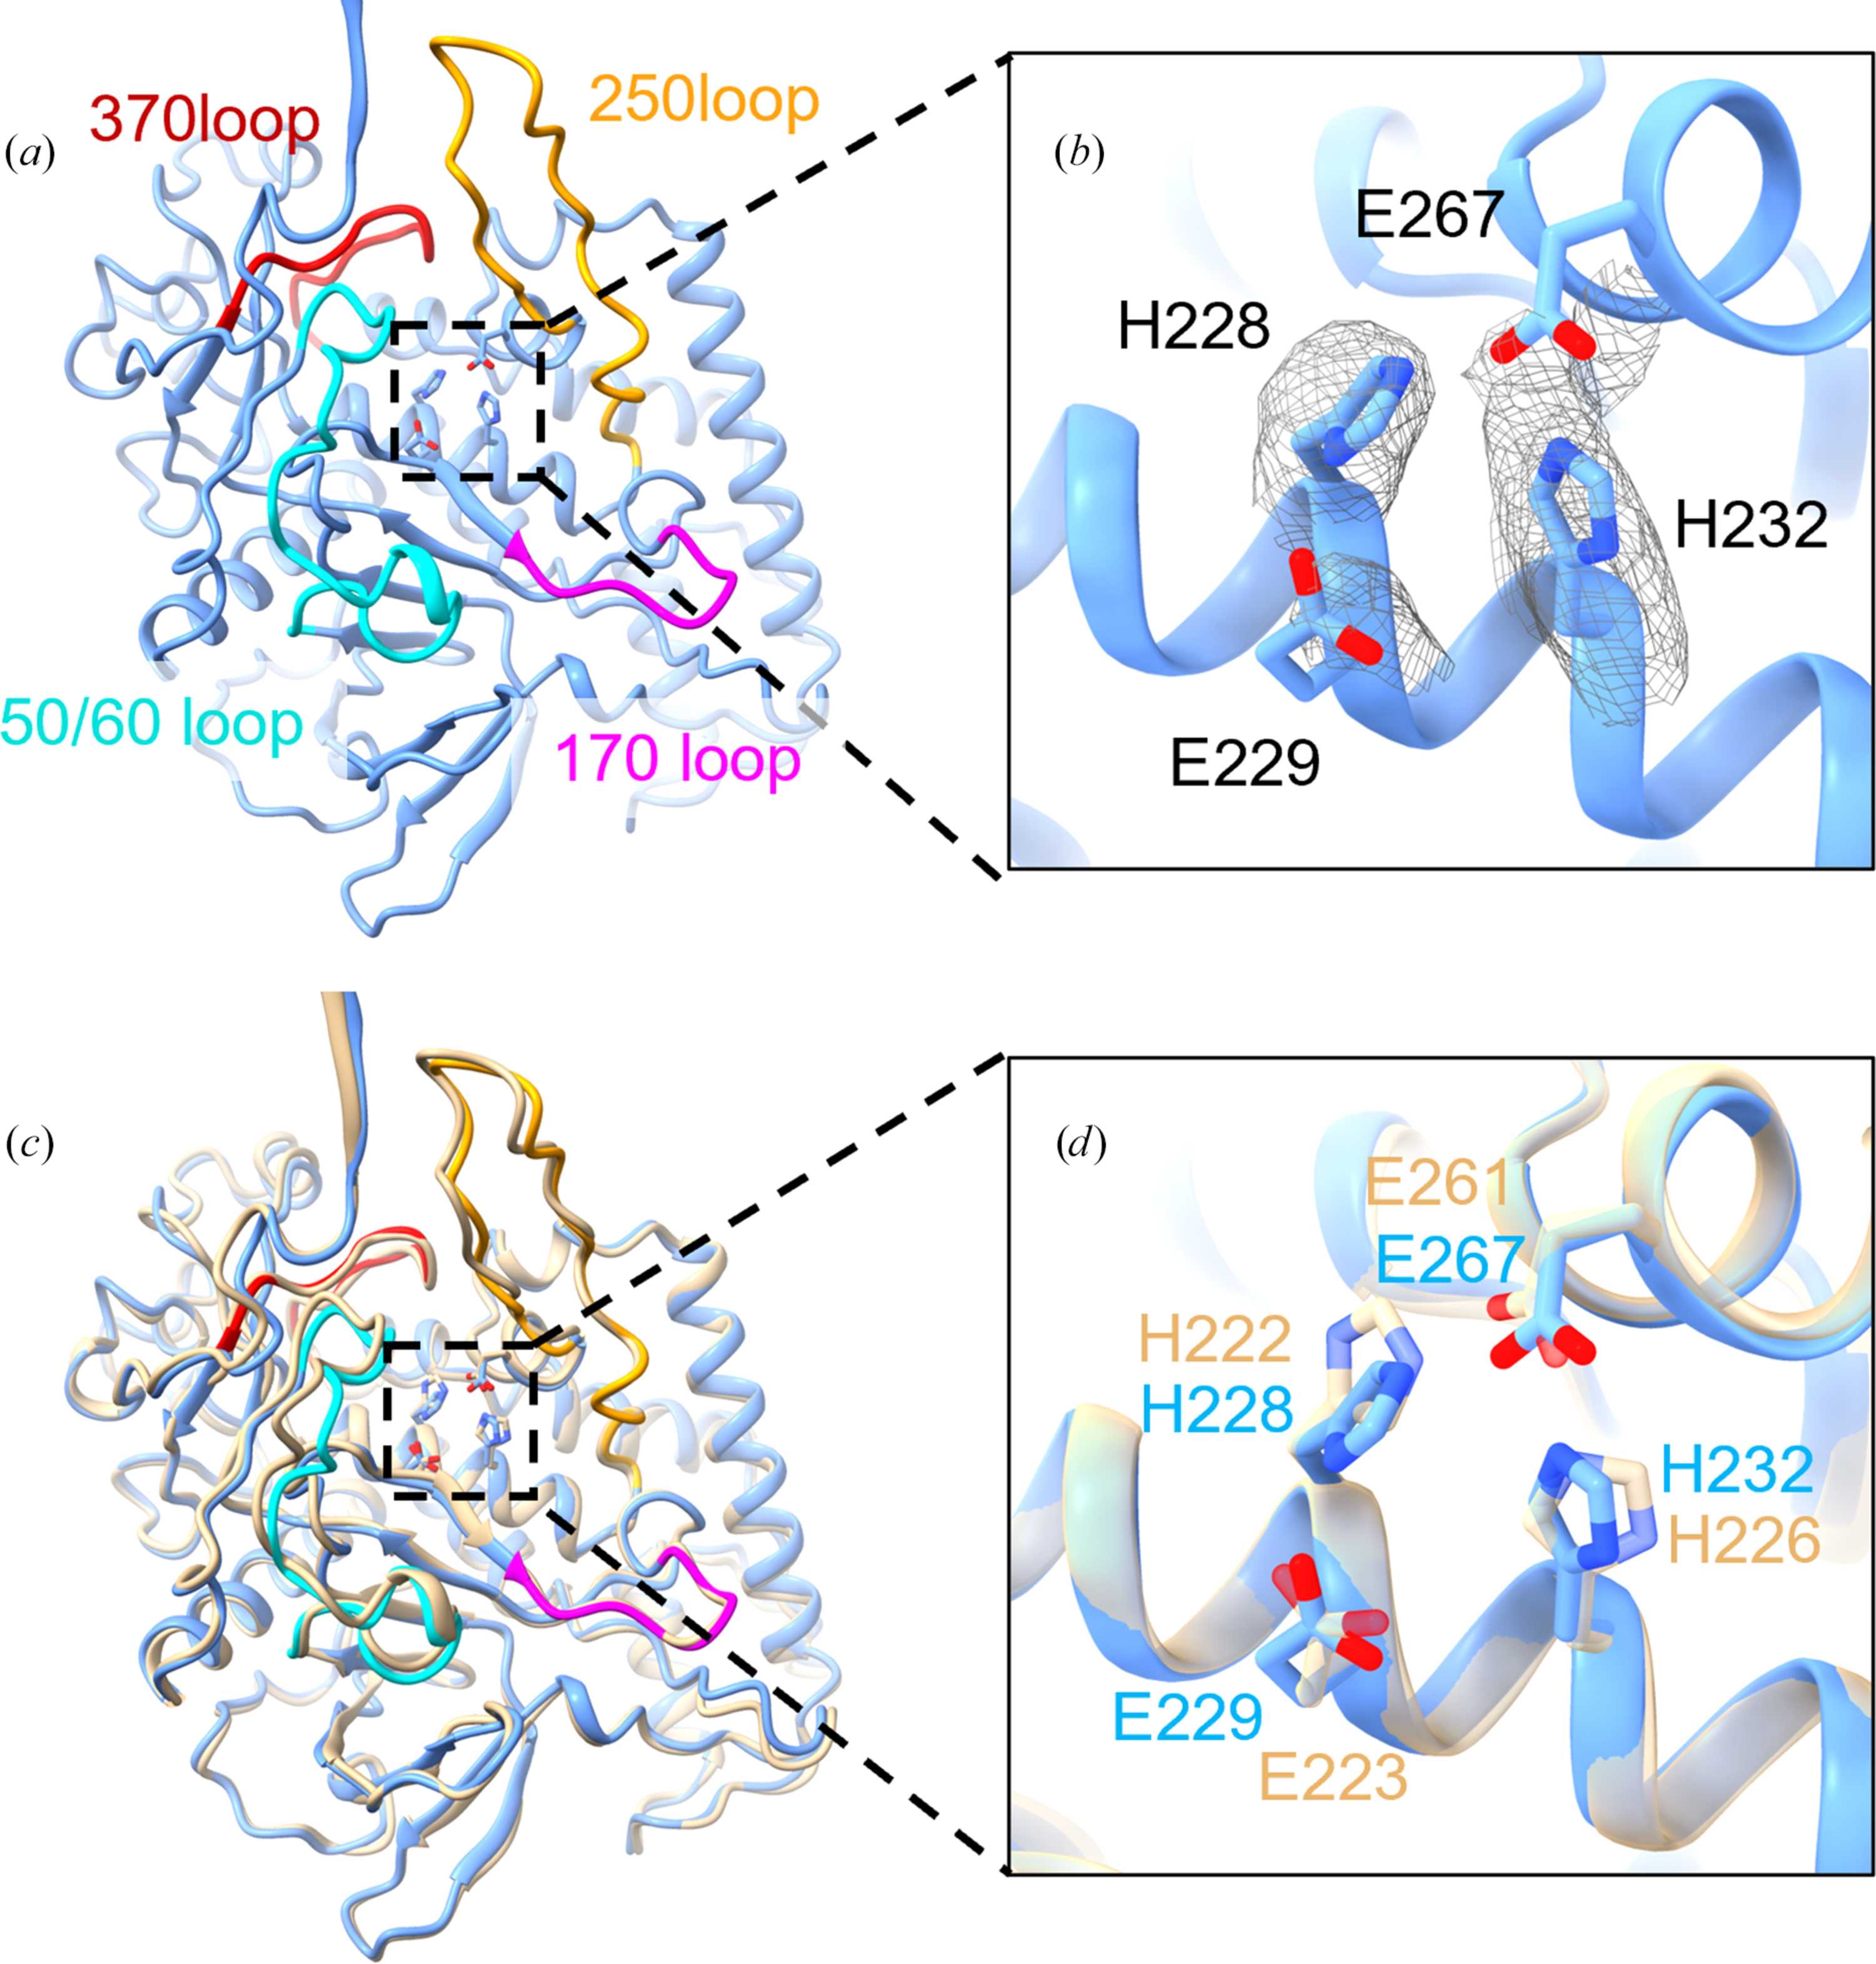
Figure 3
Structural comparison of rBoNT/A with native BoNT/A at the active site. (a) Ribbon representation of the rBoNT/A LC structure. The four flexible active-site loops are highlighted in cyan (50/60 loop), magenta (170 loop), orange (250 loop) and red (370 loop). (b) Densities of the side chains of His228, Glu229, His232 and Glu267 involved in the network at the Zn2+ binding site. (c) Side view of the superimposition of LC of rBoNT/A (blue) and native BoNT/A (PDB entry 3bta, wheat) and (d) enlarged view. |
| STRUCTURAL BIOLOGY COMMUNICATIONS |
ISSN: 2053-230X
Open  access