
Acta Crystallographica Section F
Acta Crystallographica
Section F STRUCTURAL BIOLOGY COMMUNICATIONS
Acta Crystallographica
Section F STRUCTURAL BIOLOGY COMMUNICATIONS


 menu
|
|
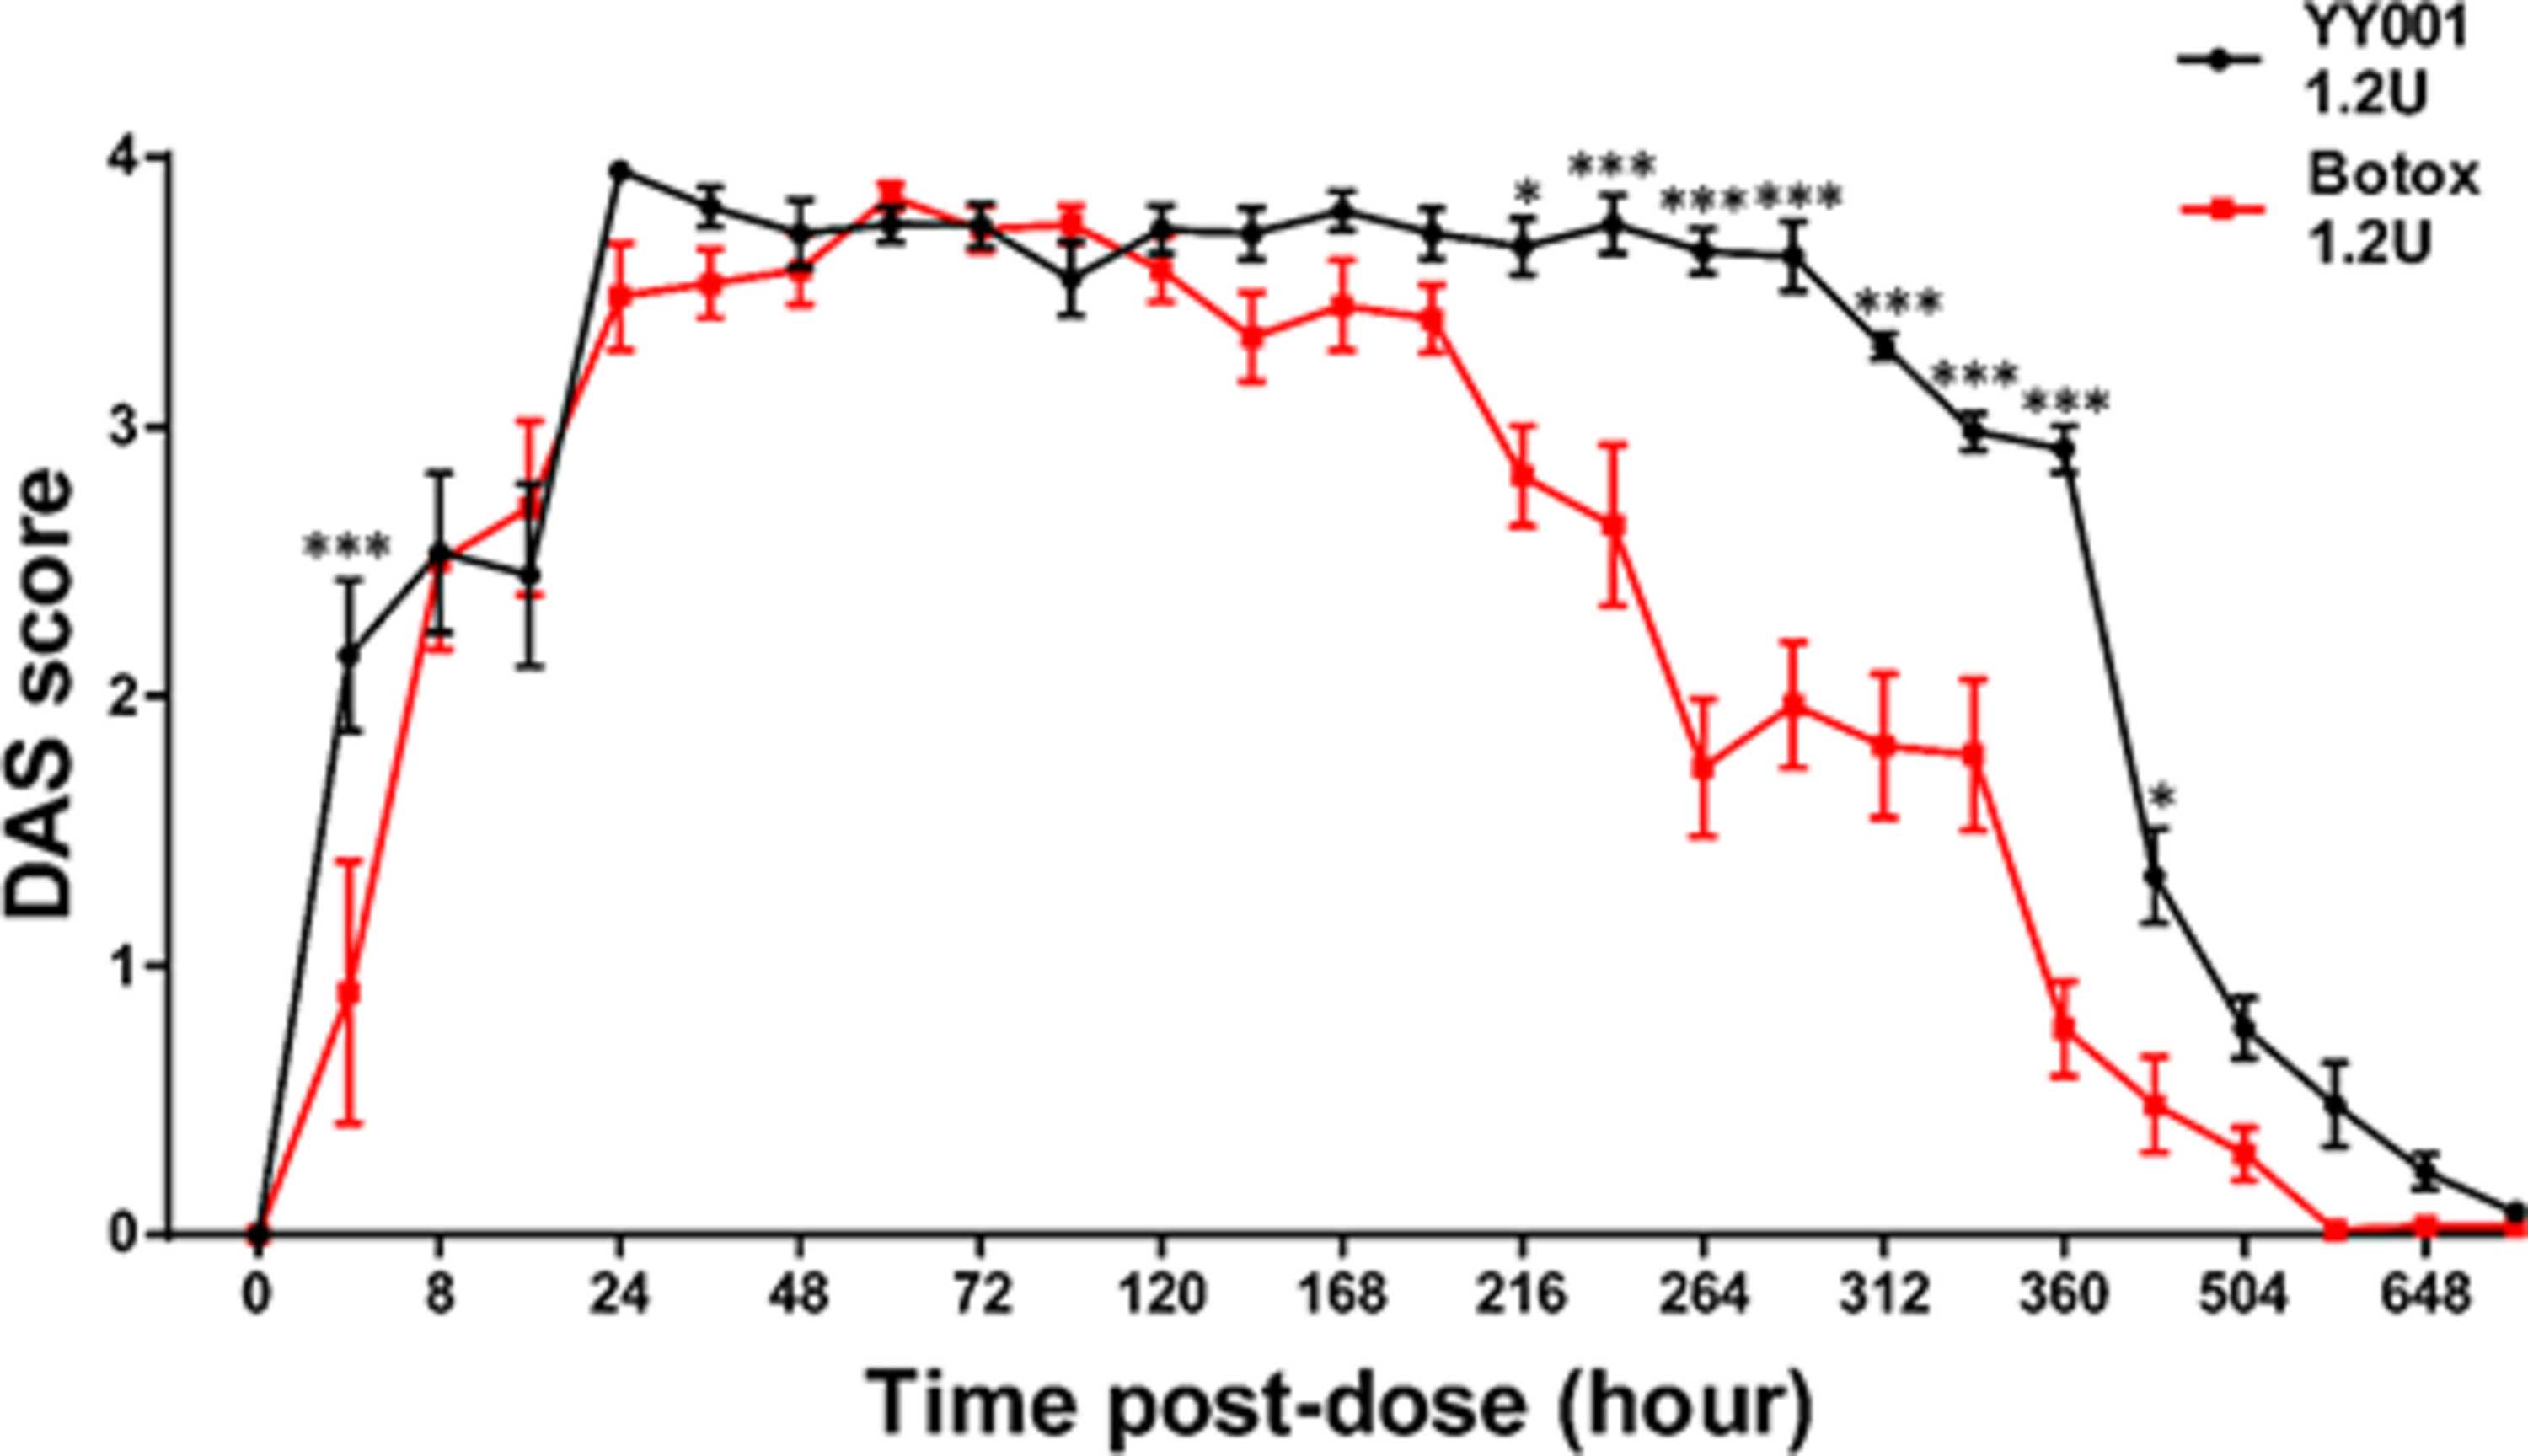
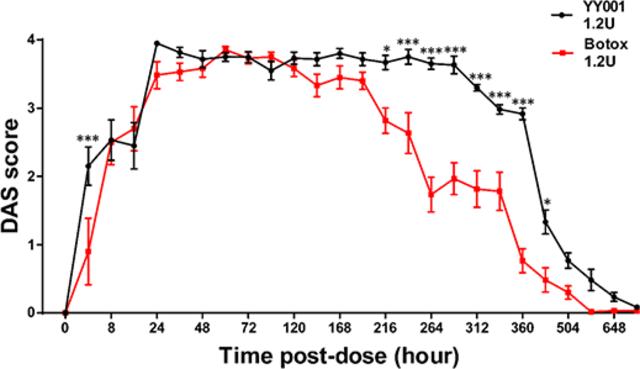
Figure 4
Trend plots of DAS scores of mice following intramuscular injection (the middle of gastrocnemius at the right hindlimb) of YY001 and Botox at 1.2 U and various time points from pre-dose to 720 h post-dose, two-way ANOVA, Bonferroni post hoc, N = 10. The DAS scores of the hind limbs digits in the YY001 group at 1.2 U were significantly higher than those in the Botox group at 216, 240, 264, 288, 312, 336, 360 and 432 h post-dose, respectively. Key: *, p < 0.05; ***, p < 0.001. |
| STRUCTURAL BIOLOGY COMMUNICATIONS |
ISSN: 2053-230X
Open  access