
Acta Crystallographica Section F
Acta Crystallographica
Section F STRUCTURAL BIOLOGY COMMUNICATIONS
Acta Crystallographica
Section F STRUCTURAL BIOLOGY COMMUNICATIONS


 menu
|
|
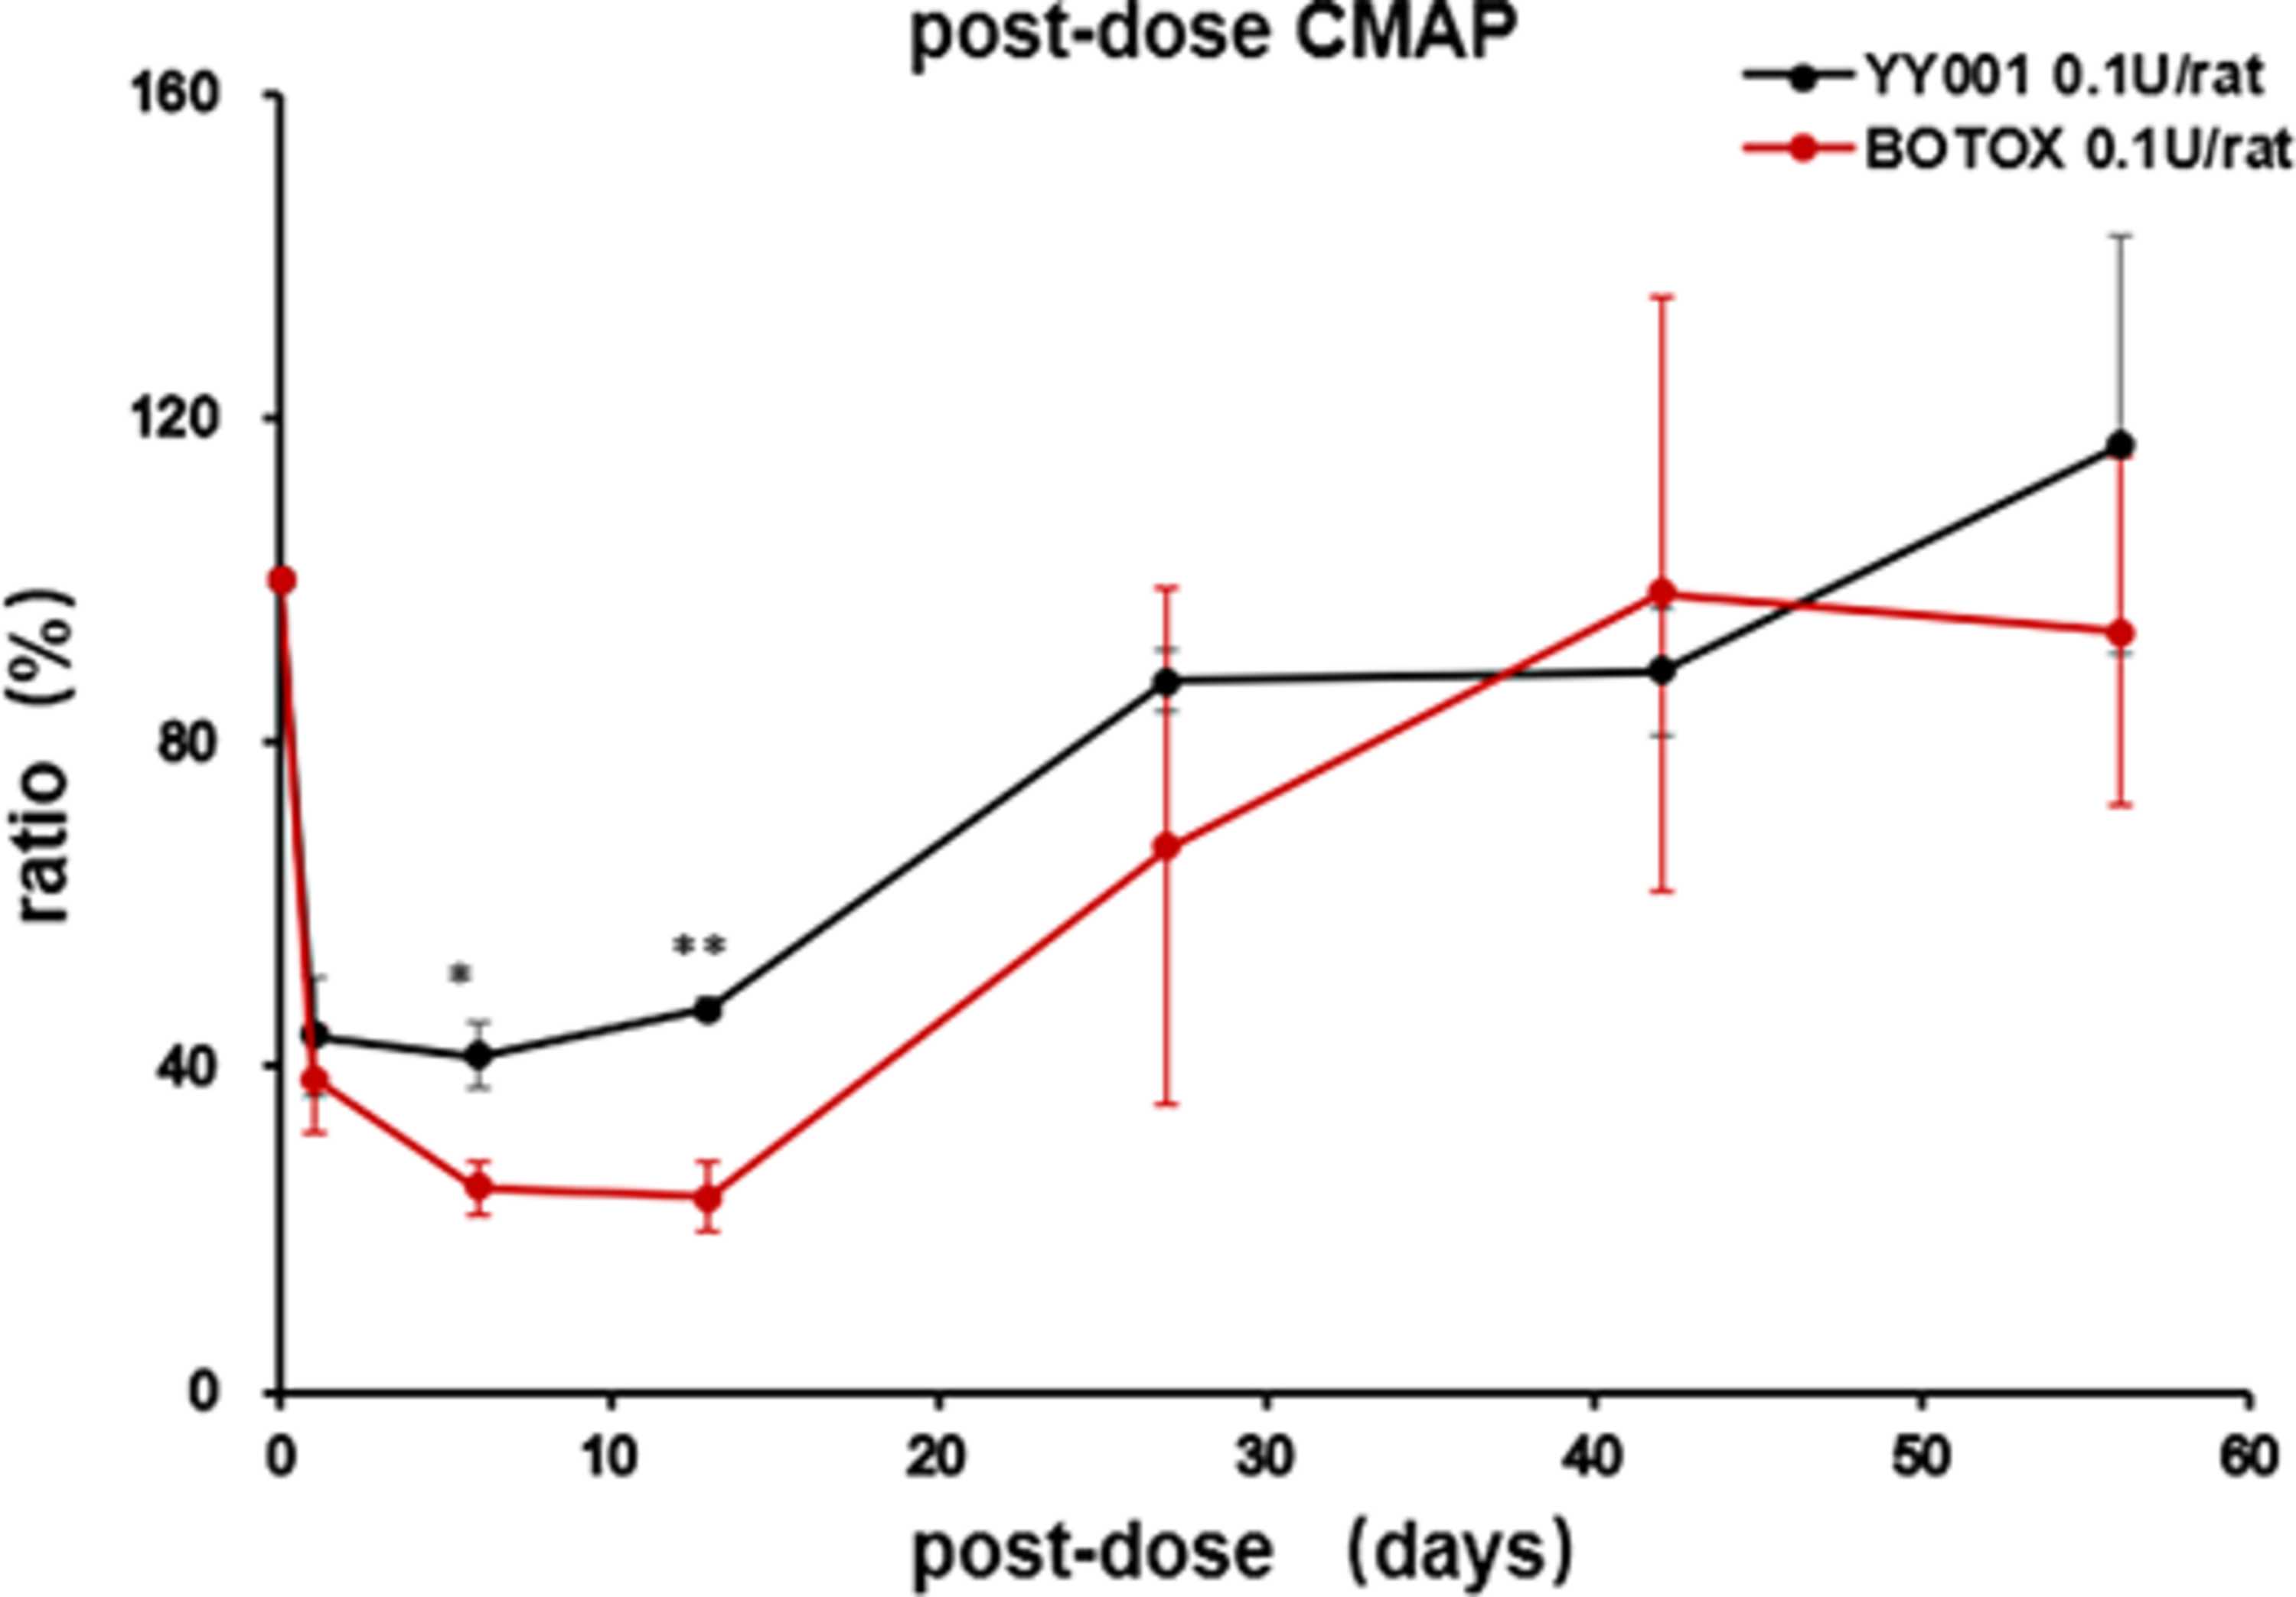
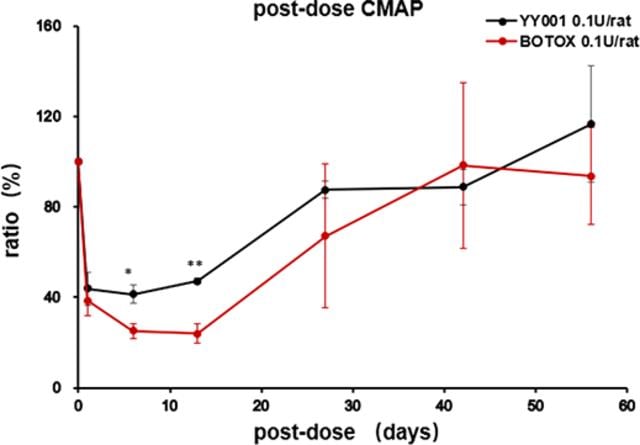
Figure 5
Trend plots of ratio of rat CMAP following intramuscular injection of YY001 and Botox at 0.1 U per rat. Key: *p, < 0.05; **p, < 0.01. |
| STRUCTURAL BIOLOGY COMMUNICATIONS |
ISSN: 2053-230X
Open  access