

 menu
menu


research papers
 | JOURNAL OF APPLIED CRYSTALLOGRAPHY |
 access
Determination of water permeability in stress-free lipid membranes through time-resolved small-angle neutron scattering

aInstitut Laue–Langevin, 71 Avenue des Martyrs, 38042 Grenoble, France, bDepartment of Chemistry and iNANO, Aarhus University, Aarhus, Denmark, cBiophysics, Institute of Molecular Biosciences, University of Graz, NAWI Graz, 8010 Graz, Austria, dPhysics Department, University of Illinois at Chicago, Chicago, IL 60607, USA, eVTT Technical Research Centre of Finland, 02044 Espoo, Finland, and fInstitute of Biotechnology, University of Helsinki, Viikinkaari 1 (PO Box 65), 00014 Helsinki, Finland
*Correspondence e-mail: [email protected]
Accurate quantification of water permeation across lipid membranes is challenging, with reported permeability values varying widely due to methodological differences and sample heterogeneity. Here, we show that time-resolved small-angle neutron scattering with rapid contrast variation enables direct non-invasive measurement of water permeation kinetics and membrane structure under iso-osmotic conditions. Our results indicate much faster water permeation in gel-phase bilayers than previously reported, likely due to improved structural control and the removal of multilamellar artefacts. Molecular-dynamics simulations agree in activation energies, though absolute permeabilities are higher in silico, highlighting methodological sensitivities. Our integrated approach offers new possibilities for future studies of diffusive solute transport across lipid membranes.
Keywords: lipid membranes; permeation; small-angle neutron scattering; SANS; molecular dynamics; MD simulations; kinetics.
1. Introduction
Biological membranes are essential for compartmentalizing biochemical processes and regulating the selective exchange of nutrients and metabolites. Molecule transport across membranes occurs through several mechanisms: facilitated transport along concentration gradients via protein channels or carriers, against concentration gradients via transporters or pumps and passive diffusion of solutes directly through the lipid bilayer (Yang & Hinner, 2015 ).
).
Passive diffusion through lipid bilayers requires the solute to overcome an activation free energy barrier to enter the membrane. This process is influenced by the physicochemical properties of the solute, such as size, charge and polarity, as well as the structural and compositional characteristics of the lipid bilayer itself (Yang & Hinner, 2015). Traditionally, passive diffusion is described by the solubility-diffusion model, which relates membrane permeability P to factors such as the solute's into the membrane (Overton's rule) and membrane thickness (Frallicciardi et al., 2022b). An alternative theory suggests that permeability is rather correlated with the area per lipid than the membrane thickness (Nagle et al., 2008).
Among solutes, the permeability of membranes to water has received particular attention. Experimental studies consistently show that water transport through lipid membranes in the lamellar fluid phase is remarkably fast, typically occurring within seconds or less, with permeability values in the range  µm s−1 (Dawson, 1988; Engelbert & Lawaczeck, 1985a,b; Hanai & Haydon, 1966; Finkelstein, 1976; Lawaczeck, 1979). These variations are primarily attributed to differences in experimental techniques and sample preparation, as well as membrane lipid composition. The predominant experimental approach in the field involves inducing rapid external osmotic stress, typically by creating salt gradients between the vesicle lumen and its exterior, and subsequently monitoring the resulting volume changes as the system equilibrates (Huster et al., 1997; Finkelstein, 1976; Reeves & Dowben, 1970; Ye & Verkman, 1989; Carruthers & Melchior, 1983; Frallicciardi et al., 2022a). However, Jansen & Blume (1995) observed a significant discrepancy in water-permeability measurements between stress-free membranes and those subjected to osmotic stress, with permeability in the latter being up to an order of magnitude higher. This difference was attributed to the mechanism of water permeation: in osmotically stressed membranes, water is thought to diffuse through transient pores, whereas in stress-free membranes, permeation occurs via a simple diffusion process. More recently, a study highlighted the challenges in producing true unilamellar vesicles (Scott et al., 2019), suggesting that internal vesicles or bilayer shells in extruded lipid vesicles may have influenced earlier reports of stress-free permeability data.
Various molecular-dynamics (MD) simulations have primarily focused on elucidating the mechanisms underlying passive transport (Frallicciardi et al., 2022b; Marrink & Berendsen, 1994, 1996; Venable et al., 2019; Saito & Shinoda, 2011). Venable et al. (2019) compared experimental and computational permeability data, revealing discrepancies of up to an order of magnitude, likely attributable to the effects of the experimentally applied osmotic stress protocols. More recently, an MD study investigated the impact of membrane curvature on fluid bilayers composed of dipalmitoylphosphatidylcholine (DPPC), demonstrating a notable increase in permeability in highly curved bilayers (Davoudi & Ghysels, 2023). Large-scale analyses utilizing simulations from the NMRlipids databank suggested non-linear dependencies of water permeation on membrane area per lipid and thickness, and overestimated permeation coefficients in simulations when compared with experiments for membranes in liquid state (Kiirikki et al., 2024).
Taken together, the discrepancies between experimental and computational permeability values, along with potential experimental artefacts arising from external osmotic stress (Jansen & Blume, 1995) and/or contributions from internal shells or vesicles in extruded lipid vesicles (Scott et al., 2019), highlight the need for a technique that eliminates the influence of osmotic stress while simultaneously assessing the lamellarity and stability of the studied lipid vesicles.
To address these challenges, we utilize time-resolved small-angle neutron scattering (TR-SANS) combined with stopped-flow H 2O/D 2O exchange in large unilamellar vesicles (LUVs; size  100 nm) under stress-free isotonic conditions. This approach leverages the significant scattering-length density (SLD) contrast between H 2O and D 2O. In this proof-of-concept study, we focus specifically on DPPC LUVs at various temperatures within the lamellar gel phase (
 ). From our measurements, we derive water permeability and activation free energies for water penetration, comparing our results with existing data and analyzing MD data extracted from the NMR database (Kiirikki et al., 2024). Finally, we discuss the advantages of our method as well as its potential limitations.
2. Materials and methods
2.1. Stopped-flow cell and time-resolved SANS
Fig. 1(a) illustrates the experimental setup, where lipid vesicles prepared in H 2O are rapidly mixed with pure D 2O. The permeation of D 2O into the vesicle lumen alters the overall contrast of the vesicles, which is monitored using TR-SANS.
![[Figure 1]](ge5184fig1thm.gif) | Figure 1 Permeability measurements by TR-SANS. (a) Schematic drawing of the experimental setup: D 2O exchange buffer and lipid vesicles in H 2O are injected simultaneously and irradiated by a neutron beam (n). The simulated intensity decay at low q illustrates how the SLD in the vesicle core (yellow) gradually matches the surrounding solvent (orange) due to permeation. (b) Stopped-flow device mounted on the D22 SANS instrument, featuring a custom-designed small-volume head with temperature control. A nitrogen stream prevents condensation during measurements at low temperatures. |
To investigate fast kinetic processes, we employed the BioLogic stopped-flow module SFM-400 system, equipped with a temperature-controlled newly custom-built neutron flow-through cell designed to generate a homogeneous flow field within the rectangular of the cell [Fig. 1(b)]. Samples were stored in thermally controlled syringes. For each measurement, 88 µL of vesicle solution (in H 2O) and 352 µL of D 2O were rapidly injected at a flow rate of 5 mL s−1, resulting in a final lipid concentration of 2 mg mL−1 in the measurement cell. Data acquisition was performed in a time-stamped `list mode' and binned into 50 ms frames. The estimated of 40 ms includes both the filling of the stop-flow internal lines and the time required to fill the 200 µL measurement cell at 5 mL s−1. Dead times of the order of a few milliseconds could be achieved by reducing the scattering volume, for example through the use of a thin-capillary geometry similar to that employed in stop-flow small-angle X-ray scattering (SAXS) measurements (Grillo, 2009). Between measurements, the measurement cell was cleaned with 6 mL of H 2O followed by 900 µL of an H 2O/D 2O mixture to ensure consistent initial conditions.
SANS measurements were conducted on the D22 spectrometer at the Institut Laue–Langevin (ILL), Grenoble, France. A two-detector setup was used, with the back detector centered 17.6 m from the sample and the front detector positioned off-center 1.4 m from the sample. This configuration enabled the capture of approximately two orders of magnitude in momentum transfer q (ranging from 0.003 to 0.6 Å ) in a single measurement. The neutron beam was collimated over 17.6 m, with a wavelength of 6 Å and a spread of
  to optimize neutron A sample aperture of 10 × 7 mm was directly mounted on the stop-flow head to minimize beam divergence. Data reduction was performed using GRASP (Dewhurst, 2023), applying flat-field, solid-angle, dead-time and transmission corrections, normalizing by incident flux, and subtracting contributions from the empty cell and solvent.
2.2. Preparation of liposomes
DPPC and dipalmitoylphosphatidylserine (DPPS) were purchased as powders from Avanti Polar (Alabaster, AL, USA) and used without further purification. Chloroform and methanol (pro analysis grade) were obtained from Merck KGaA, Darmstadt, Germany, and D 2O was from Sigma–Aldrich, France. Lipid stock solutions were prepared by dissolving weighed amounts of lipids in a chloroform/methanol mixture (2:1, vol/vol) and then combining them at a molar ratio of DPPC/DPPS (95:5 mol/mol). The addition of DPPS to DPPC prevents vesicle fusion, internal vesicle formation and multilamellarity (Scott et al., 2019), which is essential for maintaining stable unilamellar vesicles during rapid mixing. The organic solvent was removed from the lipid mixture by evaporation under a gentle N 2 stream, followed by overnight storage in a vacuum chamber.
The resulting dry lipid films were hydrated with ultrapure H 2O to a final concentration of 10 mg mL−1 and equilibrated for one hour at a temperature 10 C above the transition temperature (
 = 42C) (Tristram-Nagle et al., 1987; Nagle & Wilkinson, 1982). This was followed by five freeze–thaw cycles using dry ice, with intermittent vortex mixing. LUVs were then prepared by performing at least 31 extrusions at 50C using a handheld mini-extruder (Avanti Polar Lipids, Alabaster, AL, USA) equipped with a 100 nm pore diameter polycarbonate filter. Vesicle size and polydispersity were monitored via dynamic light scattering using a Zetasizer NANO ZS90 (Malvern Panalytical, Malvern, UK) to confirm successful extrusion.
2.3. Modeling of H 2O/D 2O exchange in unilamellar vesicles
The j of water into or out of the lumen of unilamellar vesicles is directly proportional to the concentration gradient,  , of D 2O (or H 2O) between the extravesicular solvent (
 ) and the vesicle core (
 ):
):

where P denotes the membrane permeability (Paula & Deamer, 1999).
The time evolution of is governed by a differential equation in which the rate of change of D 2O concentration inside the vesicle is proportional to the total flux through the membrane surface S and inversely proportional to the vesicle volume V. Given that the mean vesicle radius ( nm) results in a lumen volume that constitutes less than 1% of the total solvent volume in the sample, we can assume that remains constant during H 2O/D 2O exchange. As a result, is the only time-dependent variable. For spherical vesicles, the relationship becomes

Applying the boundary conditions  and
and  , the solution for
  is
is

where

The permeability-driven change in D 2O (or H 2O) content within the vesicle lumen translates directly to a variation in SANS intensity. In the simplest model, the vesicle is treated as a spherical core–shell particle – with a time-dependent core SLD,  , and a single membrane shell of constant SLD
  , corresponding to the average SLD of the lipid bilayer (including headgroups and tails). The wavelength spread and time resolution of the experiment do not justify the use of more highly resolved SLD descriptions for the lipid bilayer (Semeraro et al., 2024).
The total form factor F(q), therefore, consists of contributions from both the lipid membrane ( ) and the vesicle core (
 ), each dependent on the vesicle radius
  and membrane thickness
  :
:
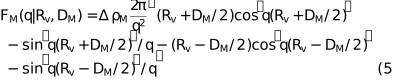
and
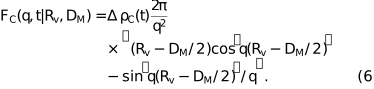
Here,  and
and  denote the contrast SLDs between the membrane/core and the external solvent (
 , i.e. D 2O/H 2O). Upon equilibration of the external and internal solvent,
  , causing the core's contribution to the overall form factor,
  , to vanish.
Accounting for polydispersity in vesicle radius with a normal distribution  , the scattering intensity is
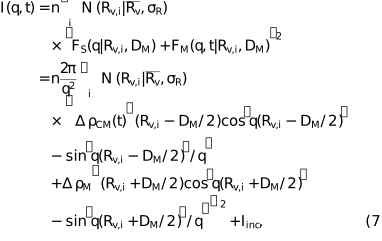
where n is the  is the SLD contrast between the vesicle lumen and the lipid membrane, and
  is the incoherent scattered intensity. The most significant changes are expected at low q [i.e. in the limit,
  ]. However, for a more robust data analysis, a wider range of q values can be considered.
Experimentally, we observe substantial changes in scattering intensity for  Å (Fig. 2). In this q range, is negligible compared with the coherent signal, allowing calculation of the integral low-q form factor
  from the scattering intensity:

Inspection of equation (7) indicates that  can be factored out of the integration over the scattered intensity, so that

where B is a constant. Furthermore, is directly related to the D 2O content in the vesicle core, and therefore to the membrane permeability [cf. equation (3)]:

where  and
and  are the SLDs of H 2O and D 2O, respectively, and
  .
.
![[Figure 2]](ge5184fig2thm.gif) | Figure 2 Permeability-induced changes in SANS data for DPPC LUVs at 283 K. (a) Comparison of initial and equilibrium scattering patterns. The first frame was recorded after a dead time of 40 ms. Solid lines represent best fits with equation (7 ), differing only in core SLD ( ). (b) Low-q scattering profiles at selected time points, with corresponding fits (solid lines). The dotted line corresponds to the calculated scattering intensity of t0. The inset displays SLD profiles for each time point. ). (b) Low-q scattering profiles at selected time points, with corresponding fits (solid lines). The dotted line corresponds to the calculated scattering intensity of t0. The inset displays SLD profiles for each time point. |
Thus, for the analysis of our time-resolved data, we obtain

where  and C is a constant.
3. Results
Fig. 2(a) presents a comparison of the scattering intensities at 283 K for DPPC LUVs prepared in H 2O, measured immediately after mixing with D 2O and after full equilibration  . The most pronounced differences between the scattering patterns appear at low q, while the patterns essentially overlap at high q. The large error bars of the first frame at high q stem from the short exposure time (six repeats of 50 ms acquisition), whereas the improved statistics for the result from a longer acquisition time (5 min). The dataset of the endstate is well described by equation (7) using
  Å, which is consistent with the previously reported membrane thickness of DPPC bilayers in the phase (Nagle & Tristram-Nagle, 2000). Parameter optimization by a least-squares fit results in a vesicle radius
  Å with 30% polydispersity. The curve obtained for the first frame is described with the same model, varying solely the D 2O/H 2O ratio inside the vesicles. From the obtained
  Å
Å , we infer that the vesicle core contains 39.1%
  0.2% D 2O. The excellent agreement between the model and data in the low-q region suggests that the overall structure of the vesicle is unperturbed by the diffusion process.
The evolution of the SANS patterns throughout the entire stopped-flow experiment is shown in Fig. 2(b) for  Å, highlighting selected time frames. Analysis of the data using equation (7) reveals a progressive decrease in the contrast between the vesicle core and the surrounding H 2O/D 2O mixture (
 ), while both the membrane thickness and vesicle radius remain unchanged. This provides clear evidence that the experimental protocol preserves the vesicle structure throughout the measurement.
The kinetics of water diffusion into the vesicles are most effectively tracked using the integral low-q form factor, as illustrated in Fig. 3 for various temperatures. At 283 K,  decayed to a constant value within 2.5 s. As the temperature increased, the rate of decline in accelerated, reaching a timescale of only a few milliseconds at 297 K. For temperatures above 297 K, the kinetics were too rapid to be resolved by the experimental setup. Importantly, and consistent with the phase, the LUV structure remained unchanged across the entire temperature range accessible for the permeability measurements.
![[Figure 3]](ge5184fig3thm.gif) | Figure 3 Decay of the integral low-q form factor at different temperatures. Black lines indicate fits using equation (11 ), constrained to common initial and final values for all temperatures. |
Water permeability was determined from the data in Fig. 3 using equation (11). As shown in Fig. 4(a), P increases monotonically from 0.016 µm s−1 at 283 K to 0.1 µm s−1 at 297 K. Additionally, the activation free energy barrier for water entry into the membrane was determined using the  , where R is the universal This analysis yielded an activation energy of
  kJ mol−1, as illustrated in Fig. 4(b).
![[Figure 4]](ge5184fig4thm.gif) | Figure 4 (a) Experimental and simulated water-permeability values for DPPC as a function of temperature. Simulation values include the average of two Slipids simulations at 293 K (NMRlipids IDs 247 and 46) (Javanainen, 2017 ), an Slipids simulation at 300 K (ID 542) (Javanainen et al., 2017), a CHARMM36 simulation at 305 K (ID 406) (Javanainen et al., 2019) and an Slipids simulation at 310 K (ID 567) (Javanainen et al., 2017). (b) Activation energy for water permeability in DPPC, extracted from experimental (red) and simulation (black) data. |
For comparison, we extracted the temperature dependence of water-permeability MD simulations with temperatures below the main available in the NMRlipids databank (five simulations in total) (Kiirikki et al., 2024), by counting the translocation events of water molecules through the bilayers (Camilo et al., 2022). However, there is limited temperature overlap between the simulations and our experimental data (Fig. 4). Furthermore, the permeability values obtained from simulations are about an order of magnitude higher than those measured experimentally, although the activation energies derived from the simulations are in good agreement with the experimental values within the margin of uncertainty.
4. Discussion
To avoid artefacts associated with the application of external osmotic stress (Jansen & Blume, 1995), we combined stopped-flow experiments with TR-SANS to measure water permeability through bilayer lipid vesicles. Two key advantages of SANS are exploited in this approach. First, the strong SLD contrast between H 2O and D 2O provides high sensitivity to H 2O/D 2O concentration gradients across the membrane, enabling quantitative analysis of water diffusion through the bilayer. Although the present study focuses on monitoring the net influx of D 2O into LUVs initially filled with H 2O, a reversed configuration – mixing LUVs containing D 2O with H 2O – would be equally feasible. Second, SANS offers high sensitivity to structural parameters of the vesicles: changes in membrane thickness or lamellarity are readily detected. For instance, the appearance of Bragg peaks in the scattering profile indicates additional bilayers within the LUVs. In the present experiments, unilamellarity was ensured by incorporating 5 mol% of the negatively charged lipid DPPS into the DPPC matrix (Scott et al., 2019).
The impact of vesicle lamellarity is highlighted by comparison with previous results obtained under stress-free conditions. Earlier measurements utilized either changes in refractive index detected by light scattering during H 2O/D 2O exchange (Lawaczeck, 1979, 1984; Engelbert & Lawaczeck, 1985a) or fluorescence quenching of a probe encapsulated within the vesicles (Lawaczeck, 1978), but lacked a direct structural characterization of the vesicles. For extruded or sonicated DPPC vesicles, permeabilities of  µm s−1 were reported between 293 and 311 K (Jansen & Blume, 1995), while
  µm s−1 was reported at 311 K (Engelbert & Lawaczeck, 1985a). The elevated permeability at higher temperature may be attributable to a phase transition at
  K from
  to
to  (Koynova & Caffrey, 1998; Nagle & Wilkinson, 1982; Tristram-Nagle et al., 1987). In contrast, our data show a steady increase in permeability within the phase itself [Fig. 4(a)], reaching approximately
  0.07 µm s−1 at 293 K. This value indicates that in our setup water permeates DPPC bilayers up to 50 times faster than previously reported. Although a direct comparison using identical conditions was not performed, it is likely that the lower permeabilities in earlier studies result from the presence of multilamellar vesicles or small entrapped vesicles, which substantially hinder water diffusion.
Nevertheless, we cannot entirely rule out the presence of artefacts in our measurements. Notably, LUVs are known to exhibit faceted rather than perfectly spherical surfaces in the lamellar gel phase (Jiménez-Rojo et al., 2015), which may indicate the presence of structural defects. Such defects will enhance permeation (Xiang & Anderson, 1994) and thus increase the apparent permeability. Ideally, measurements should be performed above the main phase transition, in the fluid  phase, where such defects are minimized. However, in the fluid phase, water translocation occurs too rapidly to capture with the current experimental setup.
MD simulations provide valuable insights into water permeability through defect-free bilayers. For fluid DPPC membranes, permeabilities of  µm s−1 at 350 K (Marrink & Berendsen, 1994) and 50 µm s−1 at 323 K (Davoudi & Ghysels, 2023) have been reported.
In this work, P values for gel-phase DPPC were obtained by analyzing permeation events in MD data from the NMRlipids databank (Kiirikki et al., 2024) using established methodologies (Camilo et al., 2022). Interestingly, these simulated gel-phase permeabilities exceed our experimental results by approximately an order of magnitude [Fig. 4(a)]. However, the activation energies for water permeation derived from both experiment and simulation agree within the respective uncertainties [Fig. 4(b)].
These results indicate that, while MD simulations accurately capture the fundamental mechanisms of water permeation, the resulting absolute permeability values remain sensitive to subtle force-field limitations and simulation parameters. Overestimation of water permeation was also observed in large-scale analyses from the NMRlipids databank for membranes in liquid state (Kiirikki et al., 2024). One plausible explanation for these observations is the overestimated self-diffusion coefficient for the TIP3P water model (often used in lipid-bilayer MD simulations, including simulations analyzed here), which leads, for example, to overestimation of protein rotational dynamics in MD simulations (Ollila et al., 2018). However, we cannot fully exclude the effects that could arise from possibly inaccurate description of gel-phase structure in MD simulations. Integrating the present experimental methodology with advanced structural characterization, such as joint SAXS/SANS measurements (Semeraro et al., 2024), promises a more rigorous foundation for identifying the membrane characteristics that regulate permeation. Such an approach would also facilitate refinement of MD force fields and simulation protocols, ultimately advancing the quantitative and mechanistic understanding of the factors that govern diffusive transport of water and other solutes across lipid membranes.
5. Conclusions
This study establishes proof of concept that TR-SANS, combined with rapid contrast variation, provides a robust non-invasive means to quantify water permeation in gel-phase lipid vesicles under stress-free conditions, thereby closely reflecting native membrane transport processes. A distinctive strength of this approach lies in its unique ability to concurrently monitor both transmembrane water and membrane structure. This is particularly significant given the pronounced dependence of diffusive water permeability on membrane composition, lipid packing and thermotropic phase state.
The results presented here naturally motivate extending this methodology to encompass a wider range of lipid compositions, solutes and temperature conditions. Such systematic studies will provide deeper insight into the fundamental determinants of diffusive solute transport across biological membrane mimics. Advancing this understanding will not only enrich the field of membrane biophysics but also inform the design of drug delivery systems and the engineering of high-performance biomimetic materials.
Acknowledgements
The authors thank the Institute Laue–Langevin (ILL) for providing neutron beam time under https://doi.org/10.5291/ILL-DATA.9-13-671. The authors thank the PSCM at the ILL for access to personnel and equipment during sample preparation. Open access publication funding provided by COUPERIN CY26.
Funding information
UP-S acknowledges travel support from the Institute Laue–Langevin (ILL) to promote scientific collaboration. OHSO acknowledges CSC – IT Center for Science for computational resources and the Research Council of Finland (grant nos. 315596 and 356568) and OSCARS, a Horizon Europe grant (GA number 101129751) led by the five Science Clusters (ENVRI, ESCAPE, LS RI, PaNOSC, SSHOC), for funding.
References
 Camilo, C. R., Ruggiero, J. R. & de Araujo, A. S. (2022). Braz. J. Phys. 52, 62. CrossRef Google Scholar
Carruthers, A. & Melchior, D. (1983). Biochemistry 22, 5797–5807. CrossRef CAS Google Scholar
Davoudi, S. & Ghysels, A. (2023). Biophys. J. 122, 2082–2091. CrossRef CAS PubMed Google Scholar
Dawson, D. C. (1988). Science 240, 228. CrossRef PubMed Google Scholar
Dewhurst, C. D. (2023). J. Appl. Cryst. 56, 1595–1609. CrossRef CAS IUCr Journals Google Scholar
Engelbert, H.-P. & Lawaczeck, R. (1985a). Ber. Bunsenges. Phys. Chem. 89, 754–759. CrossRef CAS Google Scholar
Engelbert, H.-P. & Lawaczeck, R. (1985b). Chem. Phys. Lipids 38, 365–379. CrossRef CAS PubMed Google Scholar
Finkelstein, A. (1976). J. Gen. Physiol. 68, 127–135. CrossRef CAS PubMed Google Scholar
Frallicciardi, J., Gabba, M. & Poolman, B. (2022a). Nat. Protoc. 17, 2620–2646. CrossRef CAS PubMed Google Scholar
Frallicciardi, J., Melcr, J., Siginou, P., Marrink, S. J. & Poolman, B. (2022b). Nat. Commun. 13, 1605. CrossRef PubMed Google Scholar
Grillo, I. (2009). Curr. Opin. Colloid Interface Sci. 14, 402–408. Web of Science CrossRef CAS Google Scholar
Hanai, T. & Haydon, D. (1966). J. Theor. Biol. 11, 370–382. CrossRef CAS PubMed Google Scholar
Huster, D., Jin, A. J., Arnold, K. & Gawrisch, K. (1997). Biophys. J. 73, 855–864. CrossRef CAS PubMed Google Scholar
Jansen, M. & Blume, A. (1995). Biophys. J. 68, 997–1008. CrossRef CAS PubMed Google Scholar
Javanainen, M. (2017). Simulations of Na+ and Ca2+ Binding to Phospholipid Membranes (v1.0) [Data set], https://doi.org/10.5281/zenodo.259443. Google Scholar
Javanainen, M., Martinez-Seara, H. & Vattulainen, I. (2017). Simulations of DPPC/Cholesterol Bilayers with the Slipids Force Field, Part 2/2 (v1.0) [Data set], https://doi.org/10.5281/zenodo.439080. Google Scholar
Javanainen, M., Martinez-Seara, H. & Vattulainen, I. (2019). Simulations of a DPPC Bilayer at Different Temperatures (v1.0) [Data set], https://doi.org/10.5281/zenodo.3539129. Google Scholar
Jiménez-Rojo, N., Lete, M. G., Rojas, E., Gil, D., Valle, M., Alonso, A., Moya, S. E. & Goñi, F. M. (2015). Chem. Phys. Lipids 191, 84–90. PubMed Google Scholar
Kiirikki, A. M., Antila, H. S., Bort, L. S., Buslaev, P., Favela-Rosales, F., Ferreira, T. M., Fuchs, P. F. J., Garcia-Fandino, R., Gushchin, I., Kav, B., Kučerka, N., Kula, P., Kurki, M., Kuzmin, A., Lalitha, A., Lolicato, F., Madsen, J. J., Miettinen, M. S., Mingham, C., Monticelli, L., Nencini, R., Nesterenko, A. M., Piggot, T. J., Piñeiro, Á., Reuter, N., Samantray, S., Suárez-Lestón, F., Talandashti, R. & Ollila, O. H. S. (2024). Nat. Commun. 15, 1136. CrossRef PubMed Google Scholar
Koynova, R. & Caffrey, M. (1998). Biochim. Biophys. Acta 1376, 91–145. CrossRef CAS PubMed Google Scholar
Lawaczeck, R. (1978). J. Am. Chem. Soc. 100, 6521–6523. CrossRef CAS Google Scholar
Lawaczeck, R. (1979). J. Membrain Biol. 51, 229–261. CrossRef CAS Google Scholar
Lawaczeck, R. (1984). Biophys. J. 45, 491–494. CrossRef CAS PubMed Google Scholar
Marrink, S.-J. & Berendsen, H. J. (1994). J. Phys. Chem. 98, 4155–4168. CrossRef CAS Google Scholar
Marrink, S. J. & Berendsen, H. J. (1996). J. Phys. Chem. 100, 16729–16738. CrossRef CAS Google Scholar
Nagle, J. F., Mathai, J. C., Zeidel, M. L. & Tristram-Nagle, S. (2008). J. Gen. Physiol. 131, 77–85. Web of Science CrossRef PubMed CAS Google Scholar
Nagle, J. F. & Tristram-Nagle, S. (2000). Biochim. Biophys. Acta 1469, 159–195. CrossRef PubMed CAS Google Scholar
Nagle, J. F. & Wilkinson, D. A. (1982). Biochemistry 21, 3817–3821. CrossRef CAS PubMed Google Scholar
Ollila, O. S., Heikkinen, H. A. & Iwaï, H. (2018). J. Phys. Chem. B 122, 6559–6569. CrossRef CAS PubMed Google Scholar
Paula, S. & Deamer, D. W. (1999). Current Topics in Membranes, Vol. 48, pp. 77–95. Elsevier. Google Scholar
Reeves, J. & Dowben, R. (1970). J. Membrain Biol. 3, 123–141. CrossRef CAS Google Scholar
Saito, H. & Shinoda, W. (2011). J. Phys. Chem. B 115, 15241–15250. CrossRef CAS PubMed Google Scholar
Scott, H. L., Skinkle, A., Kelley, E. G., Waxham, M. N., Levental, I. & Heberle, F. A. (2019). Biophys. J. 117, 1381–1386. Web of Science CrossRef CAS PubMed Google Scholar
Semeraro, E. F., Frewein, M. P. & Pabst, G. (2024). Methods in Enzymology: Biophysical Approaches for the Study of Membrane Structure – Part A: Experimental, Vol. 700, edited by T. Baumgart & M. Deserno, pp. 349–383. Academic Press. Google Scholar
Tristram-Nagle, S., Wiener, M., Yang, C. & Nagle, J. (1987). Biochemistry 26, 4288–4294. CAS PubMed Google Scholar
Venable, R. M., Krämer, A. & Pastor, R. W. (2019). Chem. Rev. 119, 5954–5997. CrossRef CAS PubMed Google Scholar
Xiang, T. X. & Anderson, B. (1994). J. Membr. Biol. 140, 111–122. CrossRef CAS PubMed Google Scholar
Yang, N. J. & Hinner, M. J. (2015). Methods Mol. Biol. 1266, 29–53. CrossRef CAS PubMed Google Scholar
Ye, R. & Verkman, A. (1989). Biochemistry 28, 824–829. CrossRef CAS PubMed Google Scholar
This is an open-access article distributed under the terms of the Creative Commons Attribution (CC-BY) Licence, which permits unrestricted use, distribution, and reproduction in any medium, provided the original authors and source are cited.
| JOURNAL OF APPLIED CRYSTALLOGRAPHY |
access