

 menu
|
|
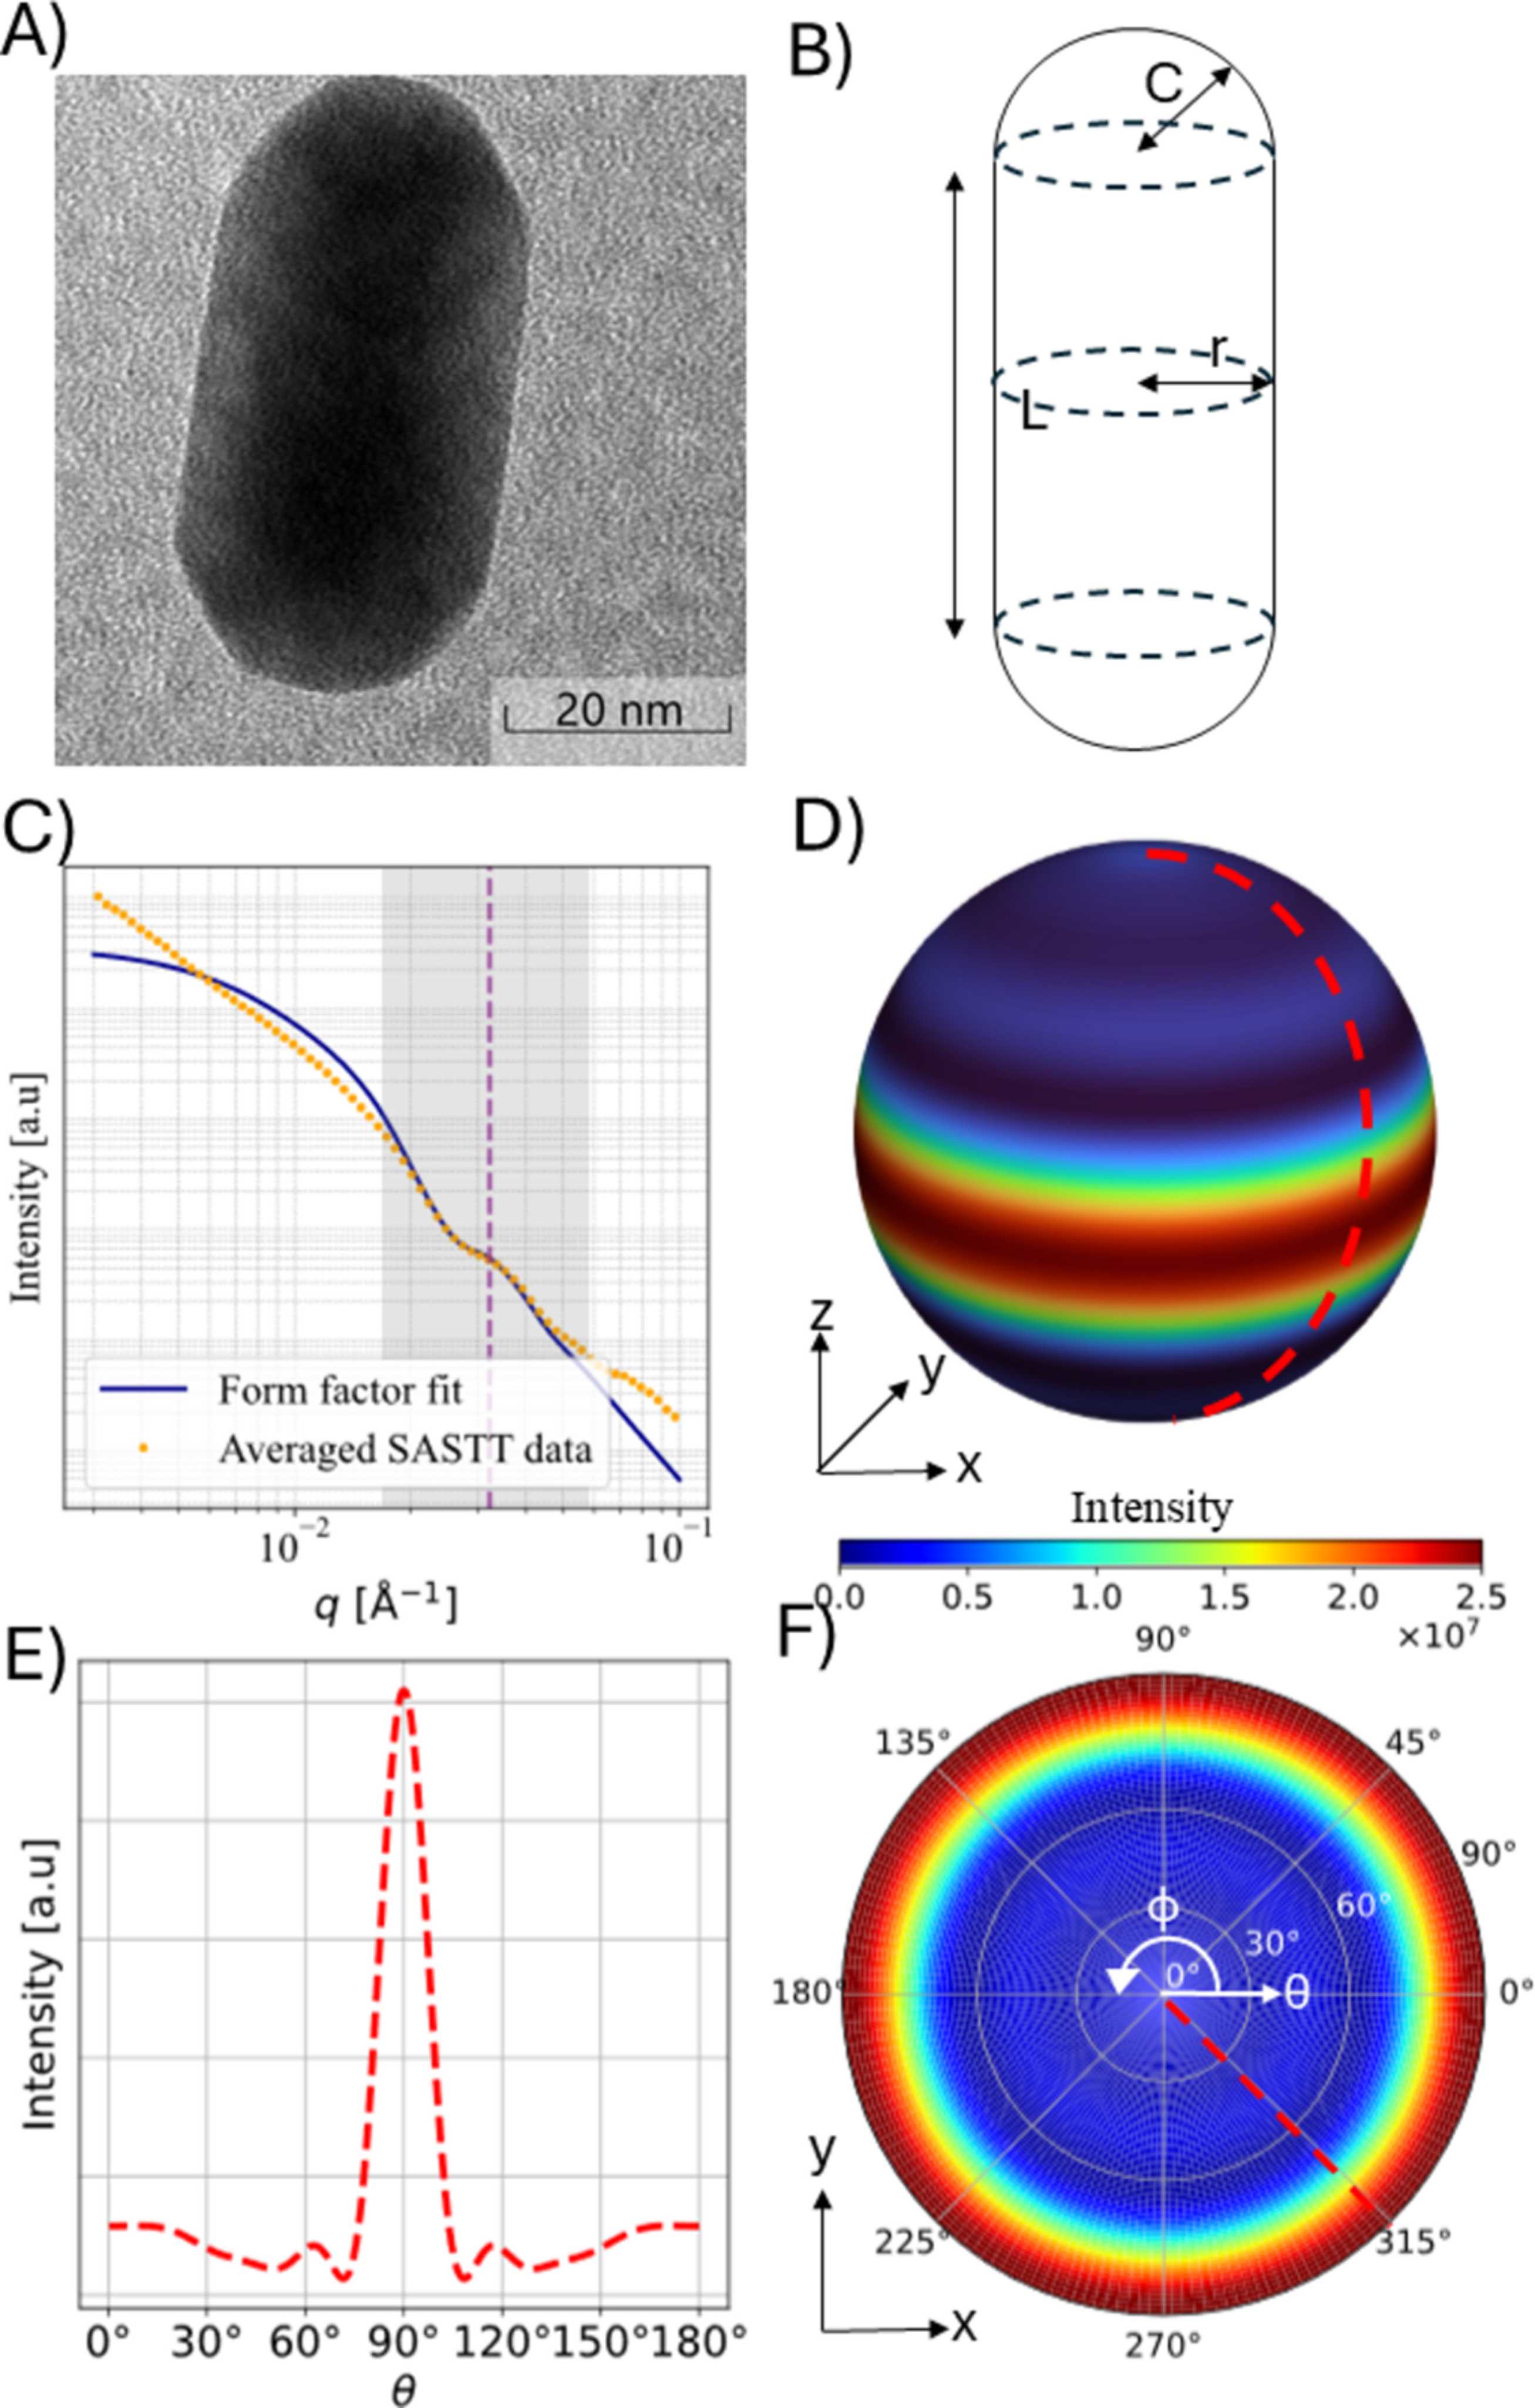
Figure 3
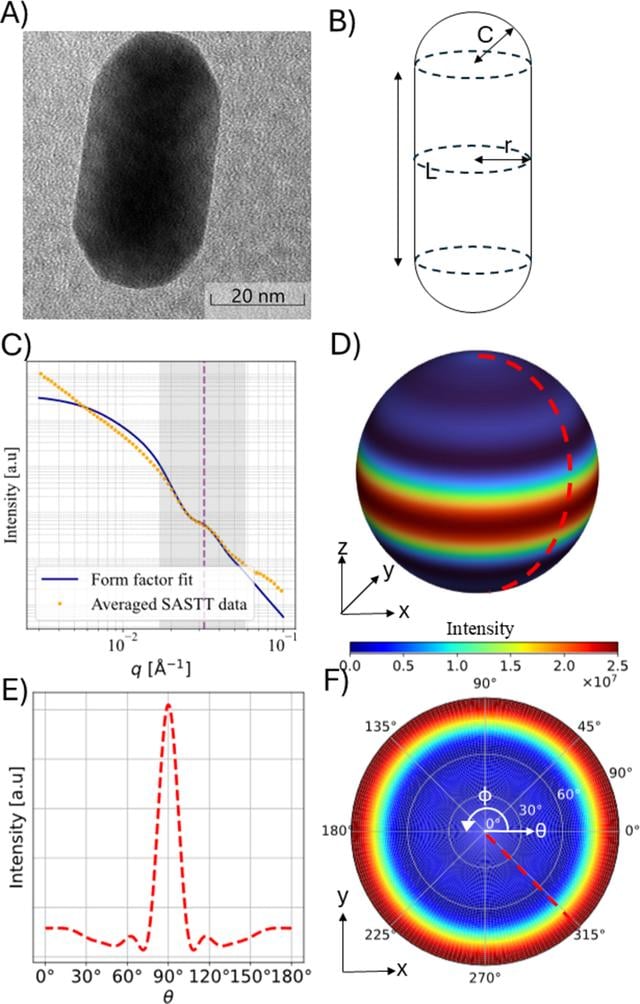
(a) shows a transmission electron microscopy image of the gold nanorod. (b) shows the model of the gold nanorod that was used for the form factor modeling, which is a capped cylinder of C = r = 150 Å and L = 500 Å, with a lognormal distribution of the radii. (c) shows the radial integration of the averaged reconstruction as well as the modeled form factor, with the purple dotted line showing the q value that is depicted in (d), (e) and (f). (d) and (f) show the values of the form factor on a 3D sphere and in a pole figure, respectively. (e) shows the values of the form factor for different θ. As the form factor is axially symmetric it depends only on θ and not ϕ. |
 | JOURNAL OF APPLIED CRYSTALLOGRAPHY |
ISSN: 1600-5767
 access