

 menu
|
|
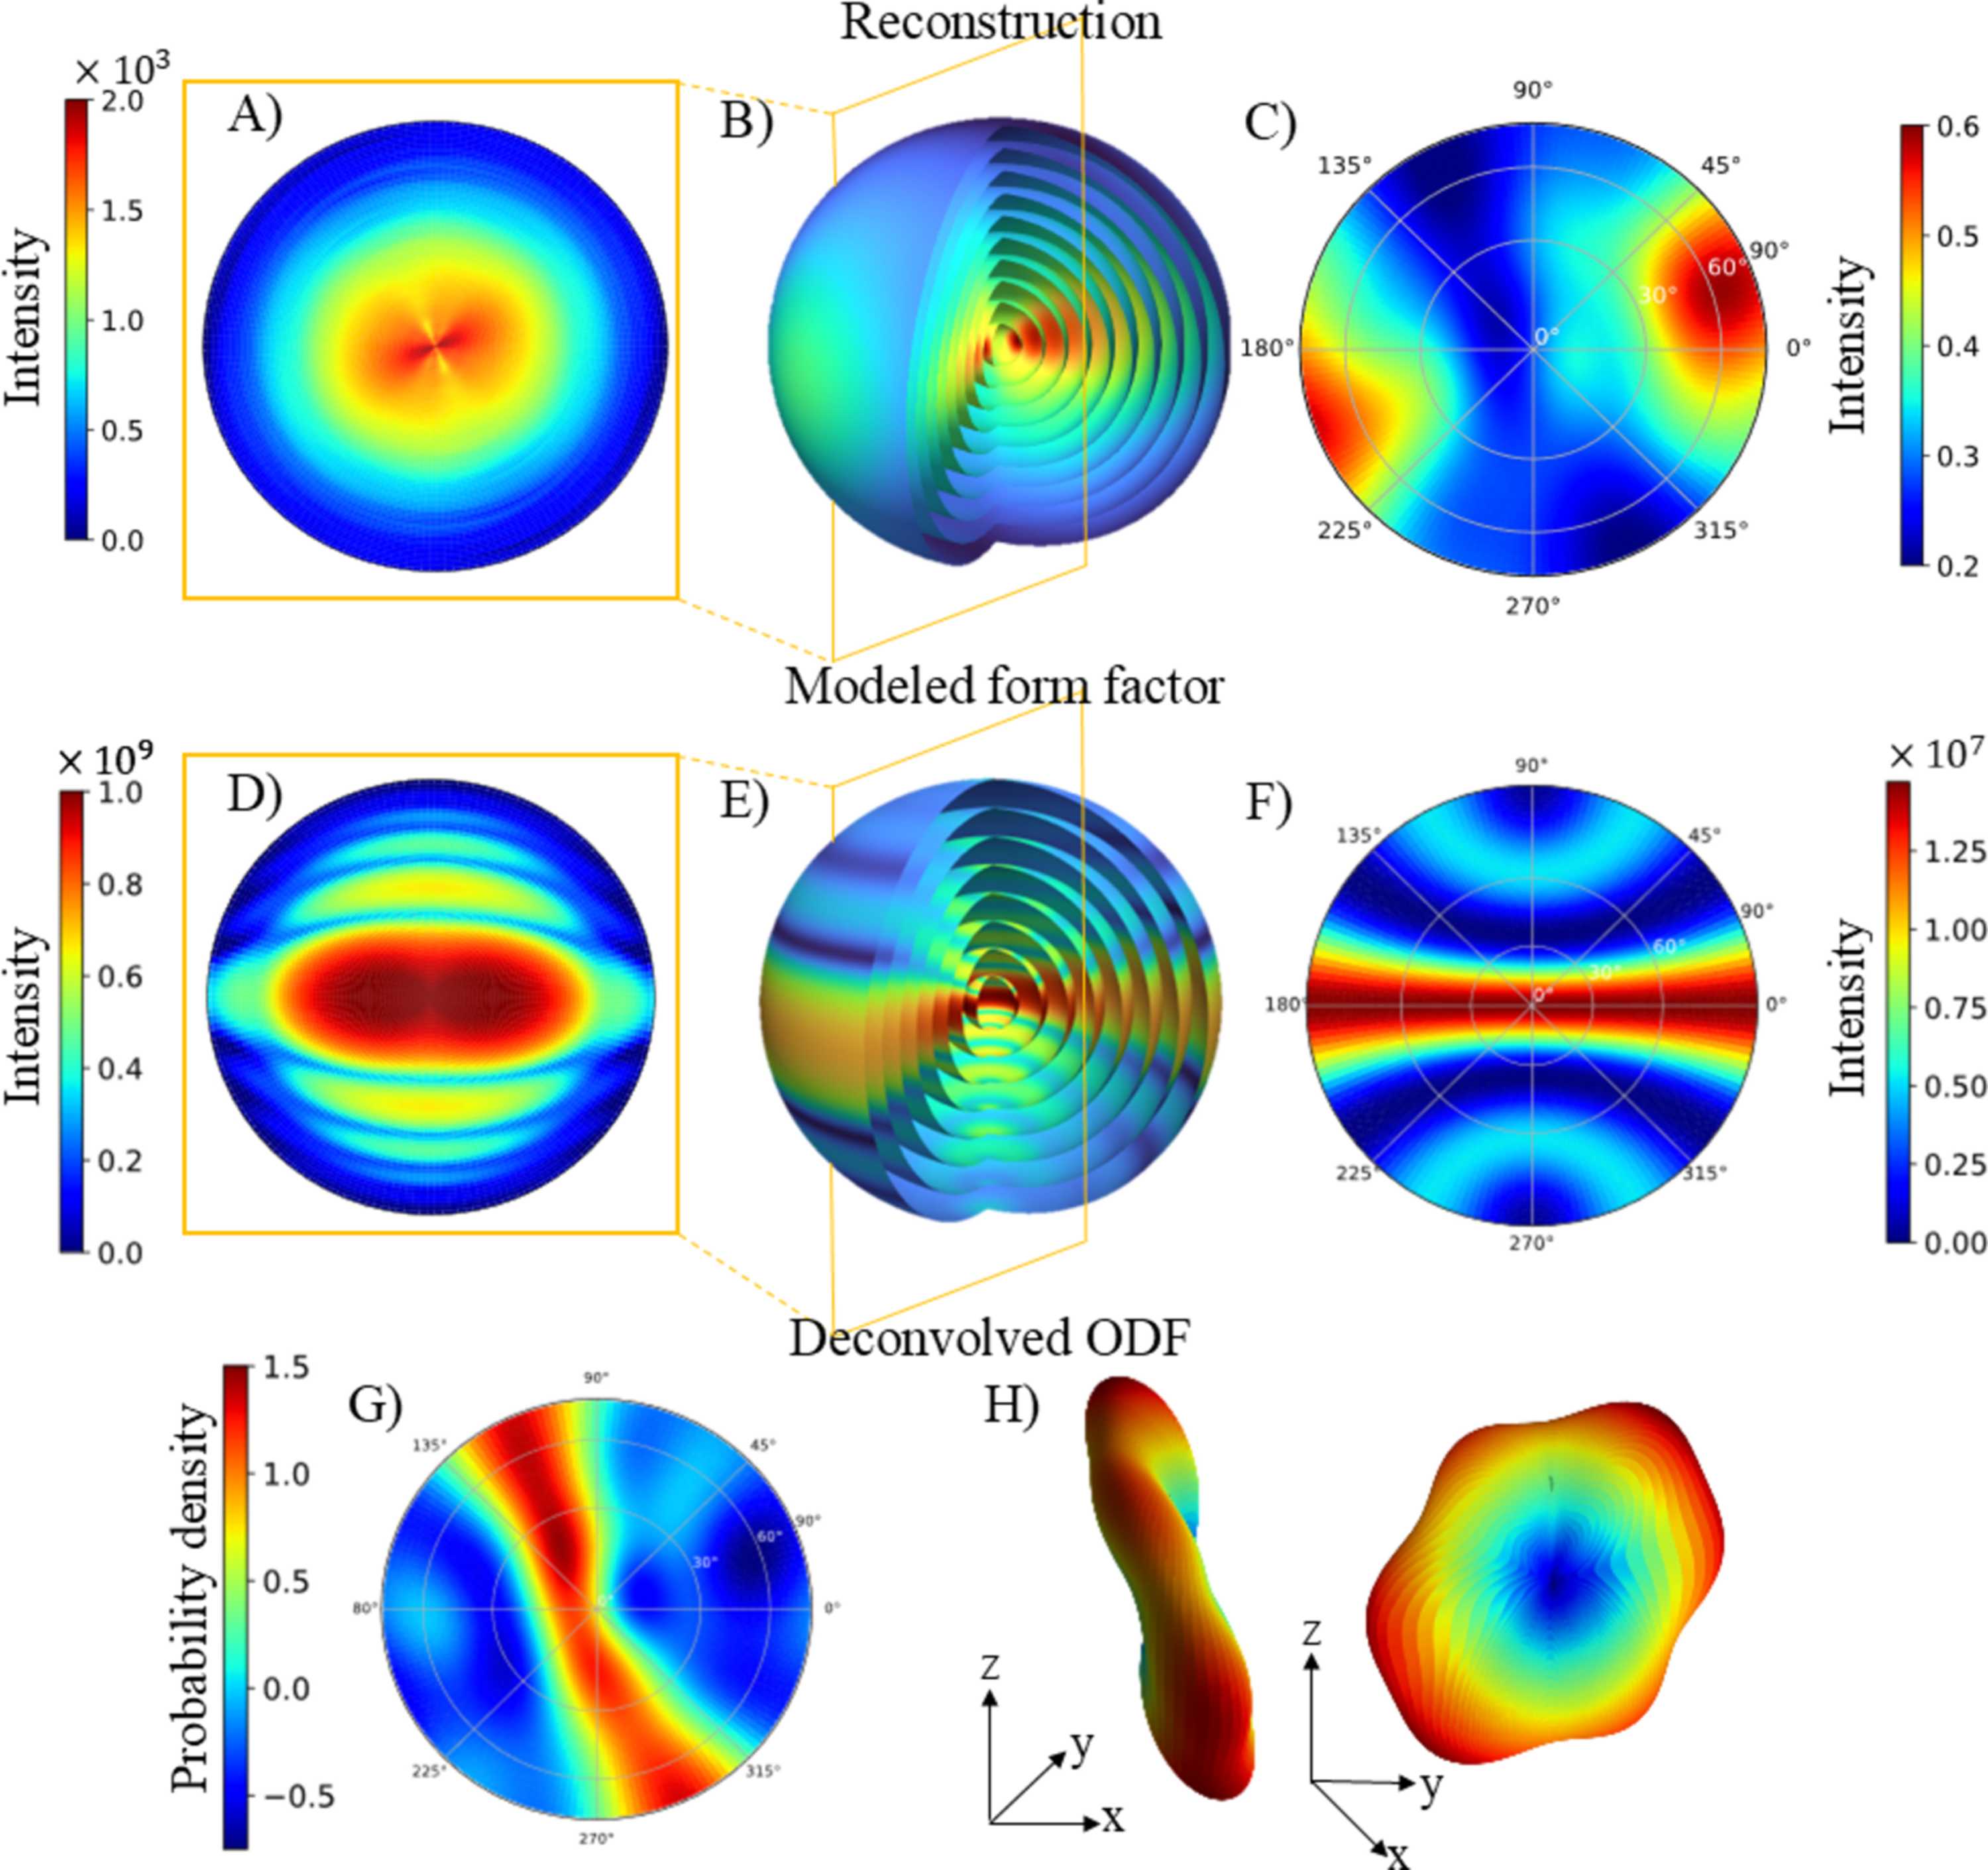
Figure 4
3D RSM of the reconstruction. The modeled form factor is shown in (d)–(f) and the ODF is presented in (g)–(h). (b) and (e) illustrate the 3D RSM using concentric spheres at q values around q = 0.038 Å−1, the same q value that is marked in Fig. 3  . (a) and (d) show planar cuts through the 3D RSM, which correspond to the scattering pattern that would be observed if the voxel was measured in isolation, with the incident X-rays perpendicular to the plane of the cut. (c), (f) and (g) show pole figures evaluated at q = 0.038 Å−1. The ODF is visualized in (h) as a 3D representation where both the radial distance from the center and color indicate the probability of finding the gold nanorods aligned along that direction, and it shows two alternative viewing angles of the same ODF. |
 | JOURNAL OF APPLIED CRYSTALLOGRAPHY |
ISSN: 1600-5767
 access