

 menu
|
|
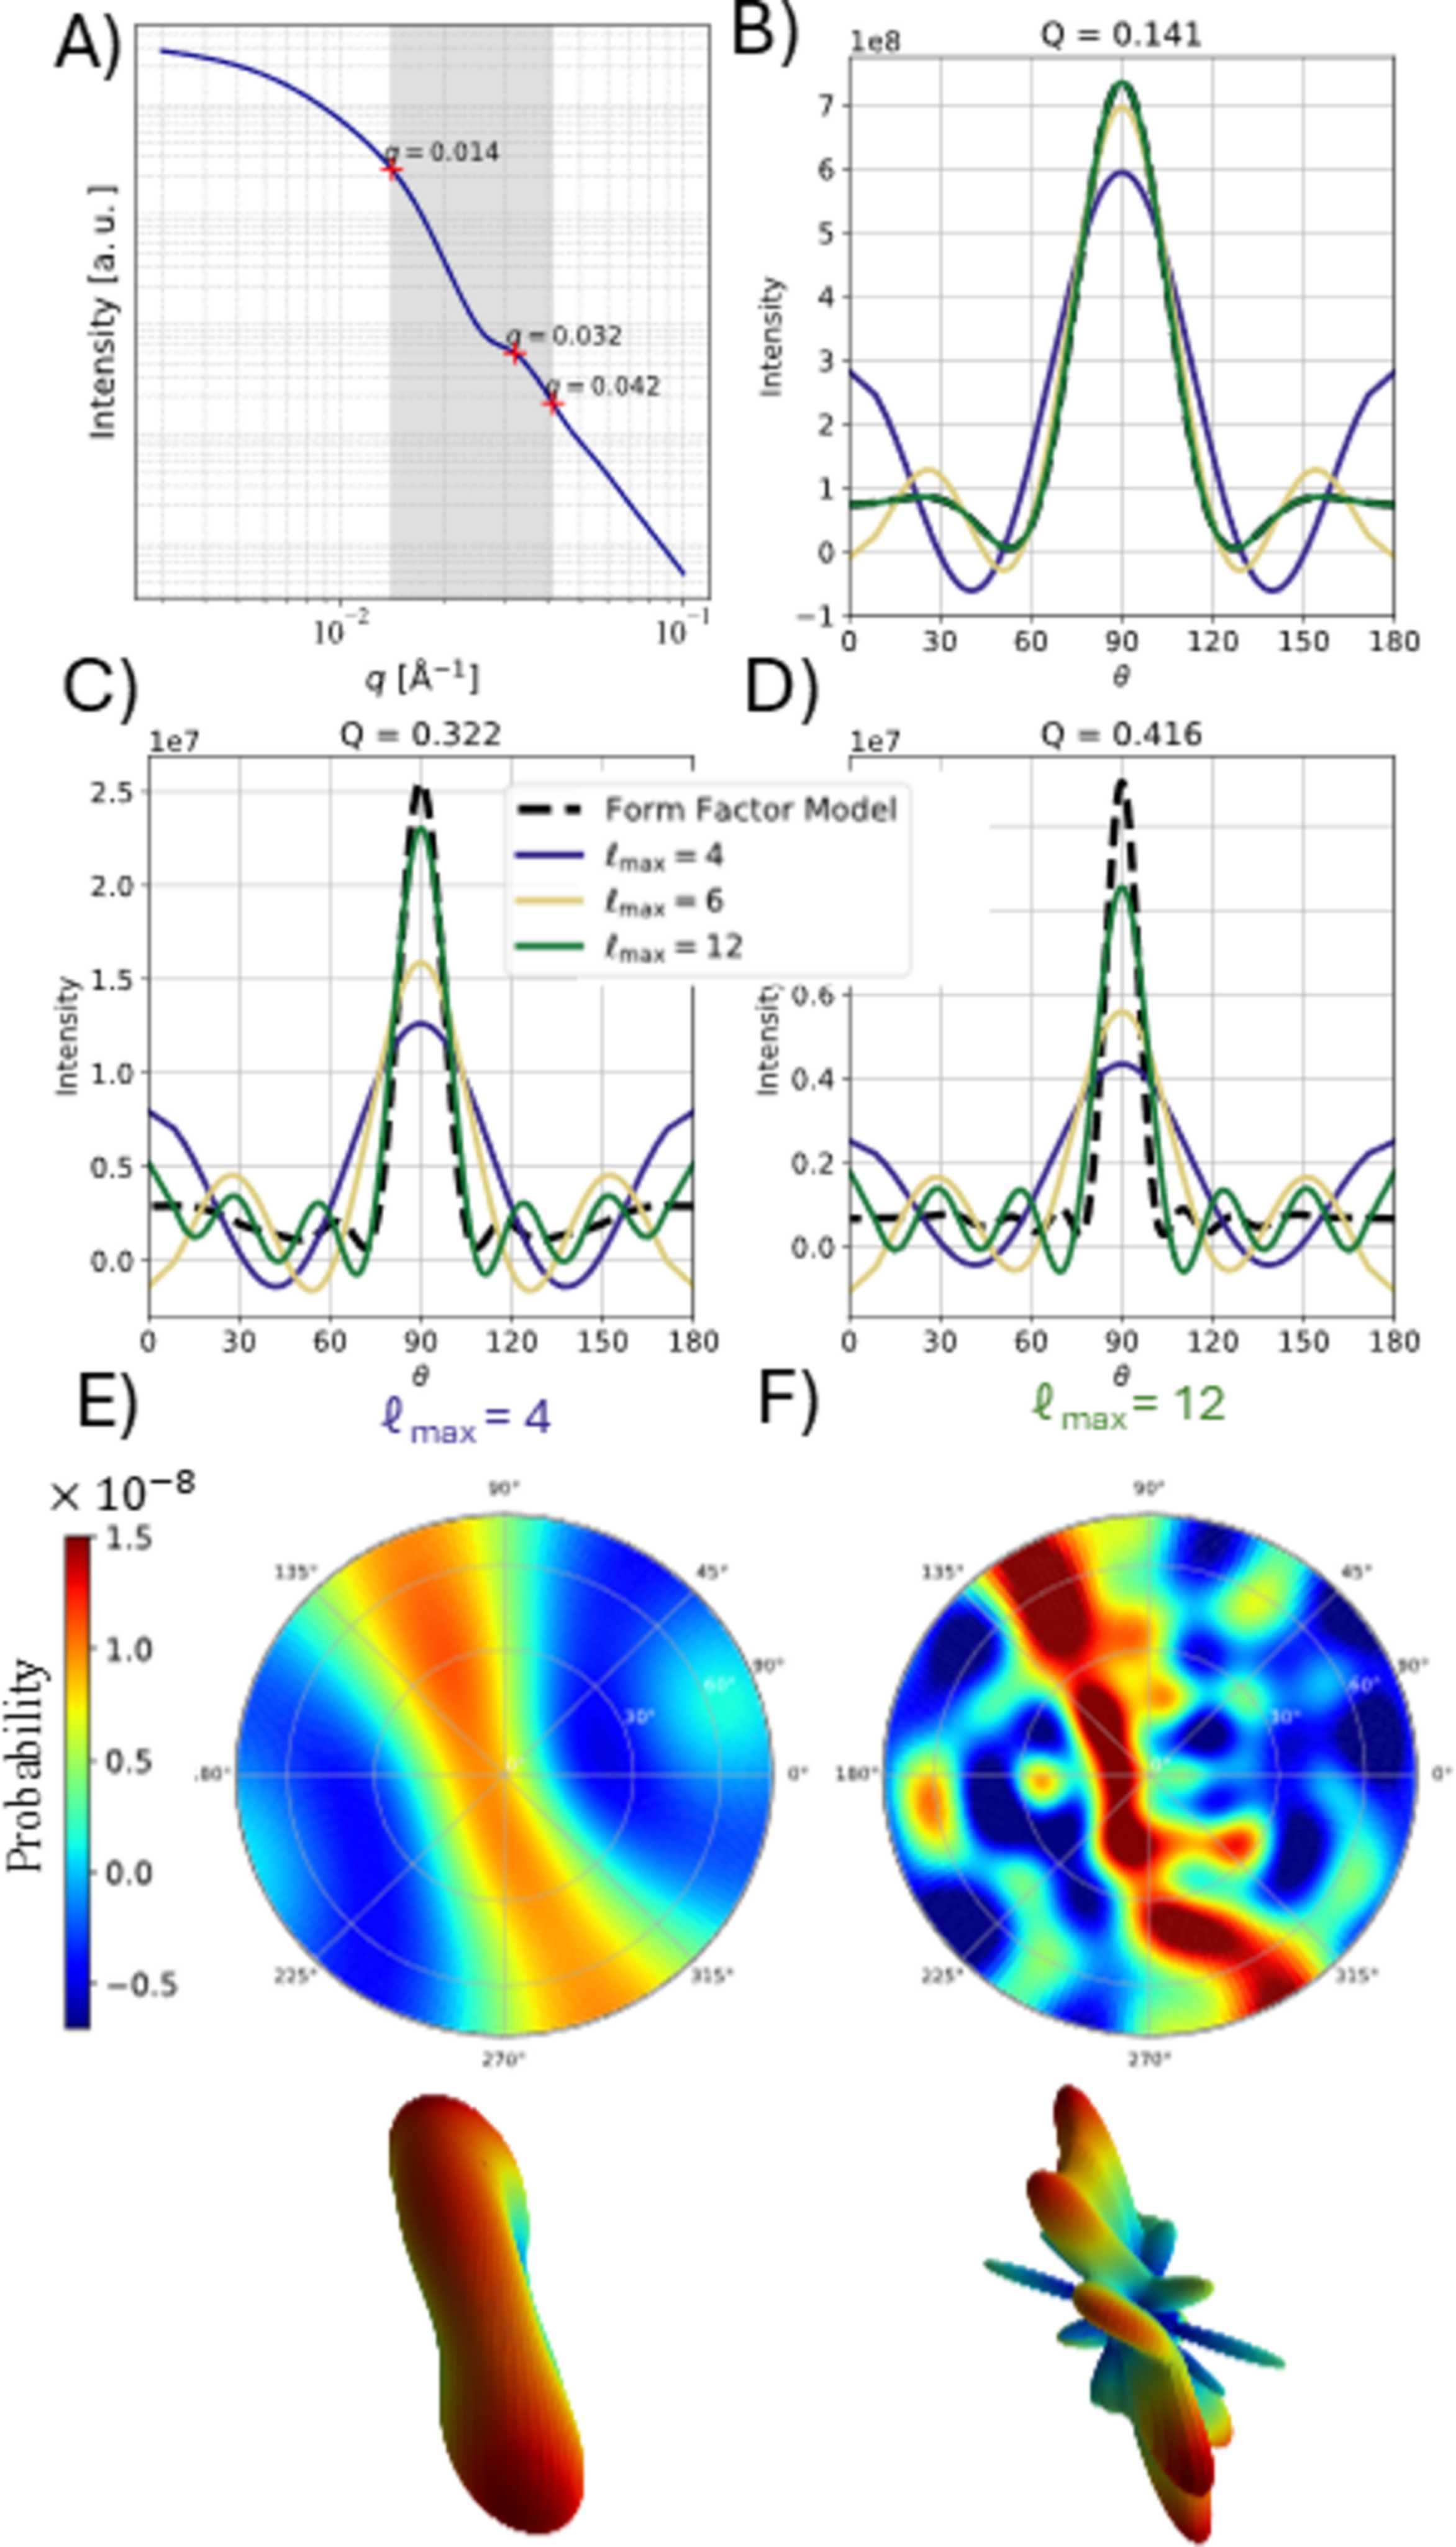
Figure 5
(a) shows the I(q) of the form factor; the gray area marks the interval that is used to find the ODF. The three marked q values are the same q values that are used to show  in (b)–(d). The ODFs are shown as pole figures and in 3D representations for  and  , in (e) and (f), respectively. |
 | JOURNAL OF APPLIED CRYSTALLOGRAPHY |
ISSN: 1600-5767
 access