

 menu
|
|
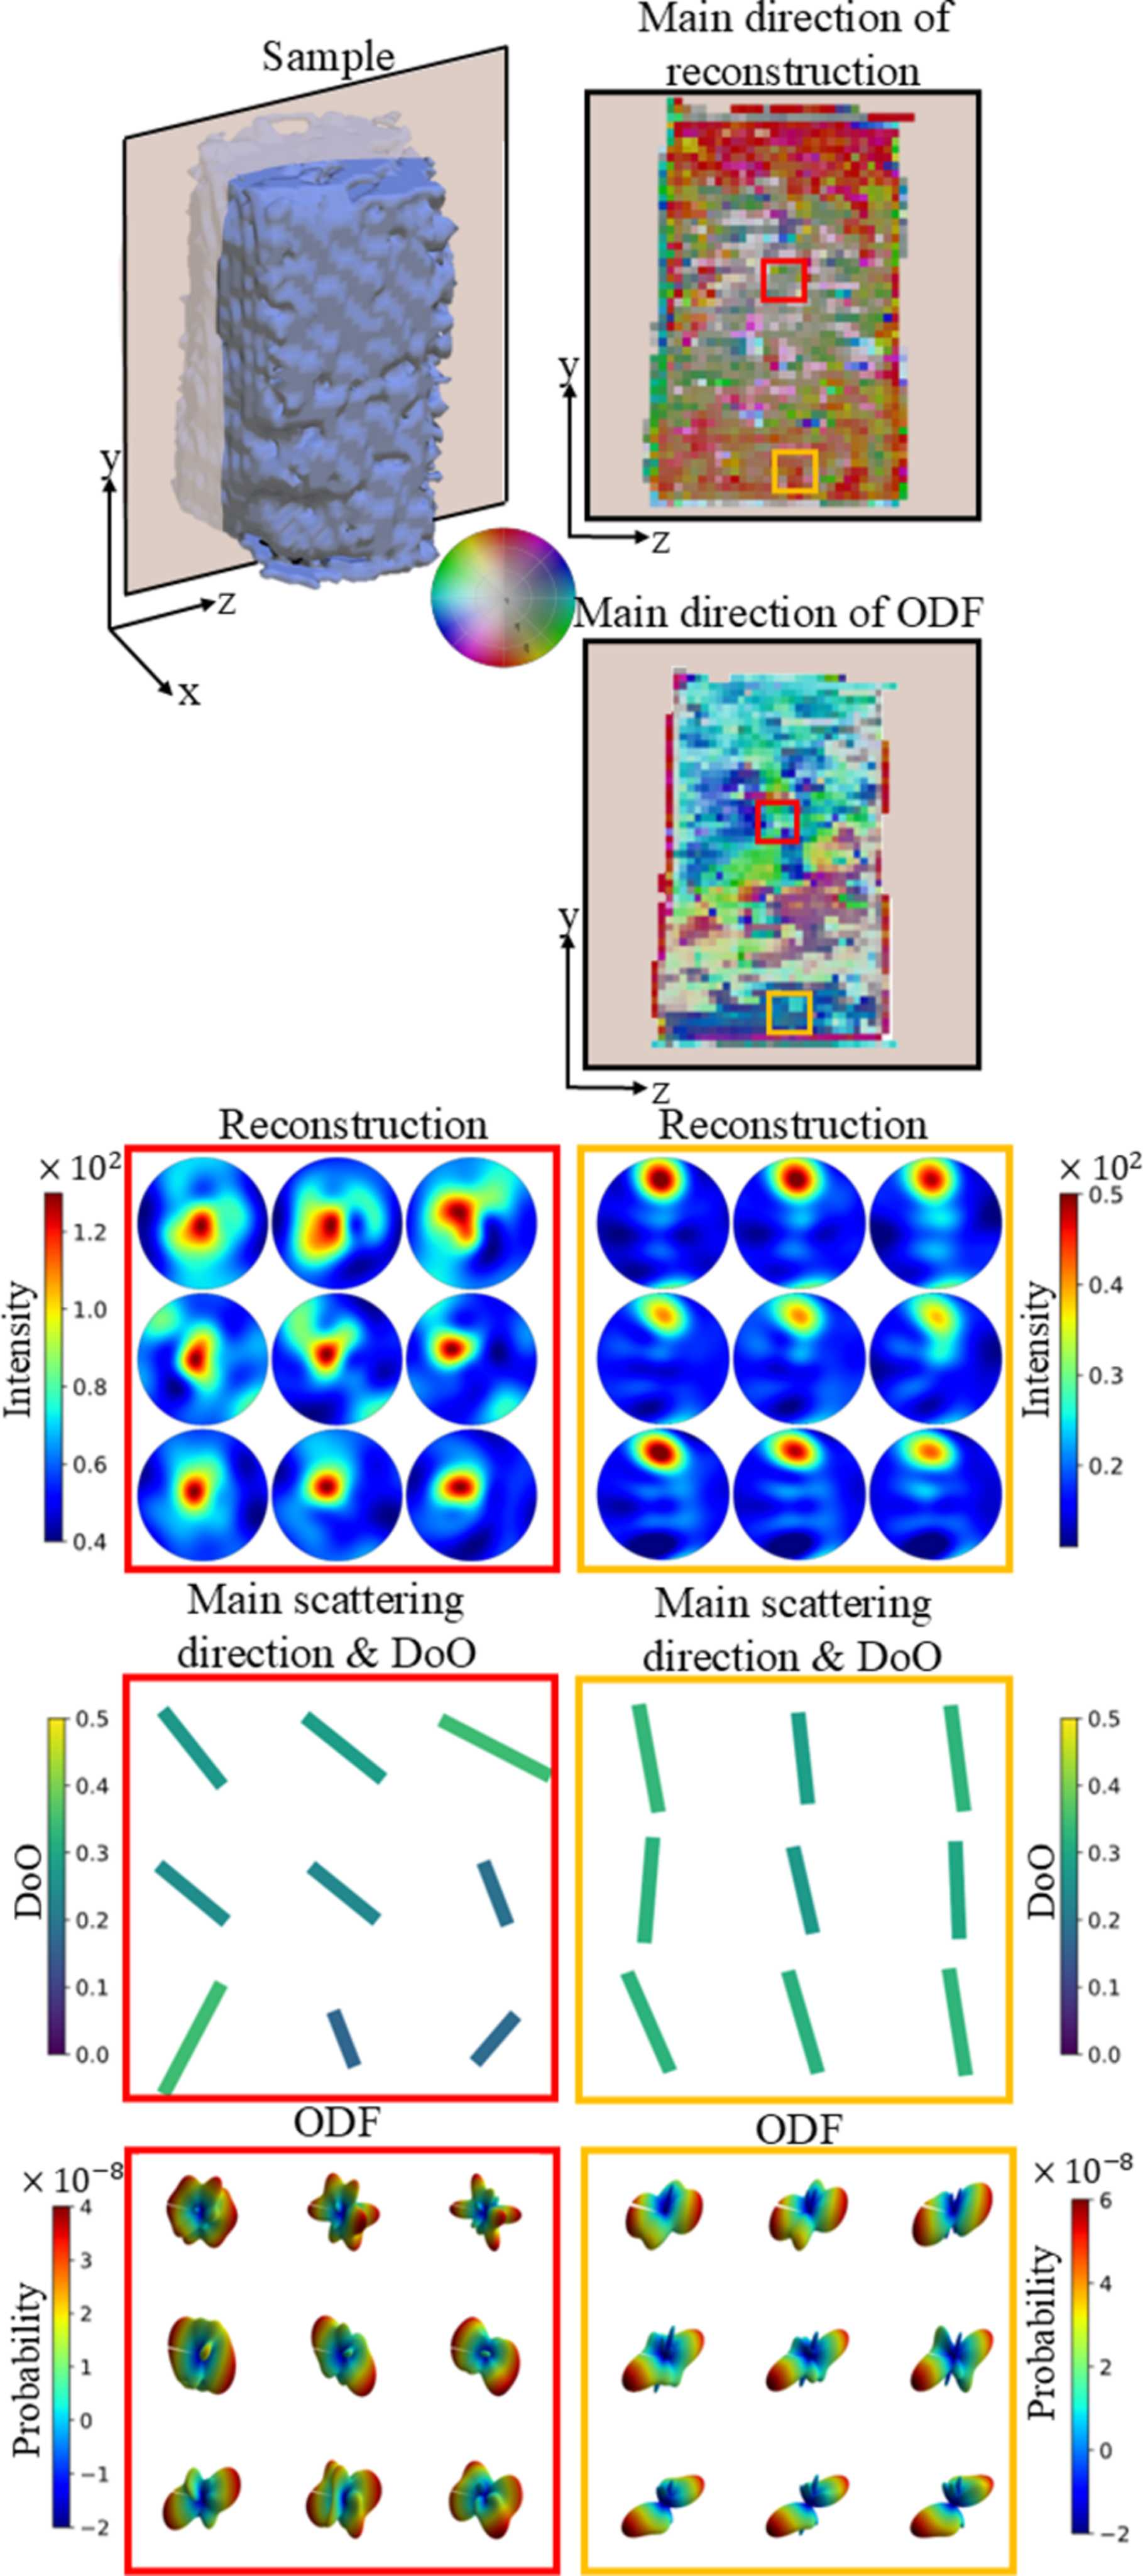
Figure 6
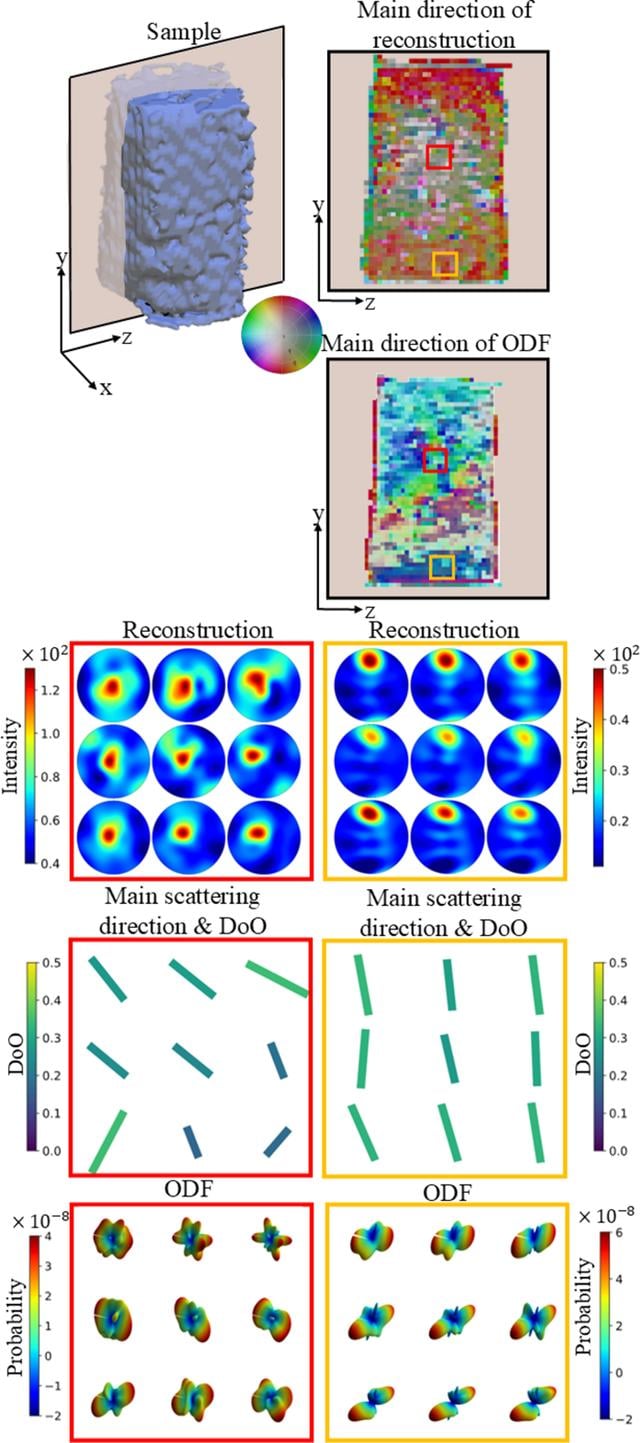
The top-left figure illustrates the sample, with a semi-transparent plane indicating a cross-sectional cut. This cut is shown in two dimensions, and the main directions of both the reconstruction and the ODF are color-coded according to the color wheel. Directions perpendicular to the cut appear in grayer tones. Pole figures from the reconstruction are shown for two distinct regions of the sample, one from the center and one from the edge. The main direction of the scattering and the degree of orientation (denoted DoO) are represented by color-coded bars. The direction of each bar corresponds to the main orientation projected onto the yz plane, while its color and length are scaled according to the degree of orientation. The ODF is visualized in its 3D representation. |
 | JOURNAL OF APPLIED CRYSTALLOGRAPHY |
ISSN: 1600-5767
 access