

 menu
|
|
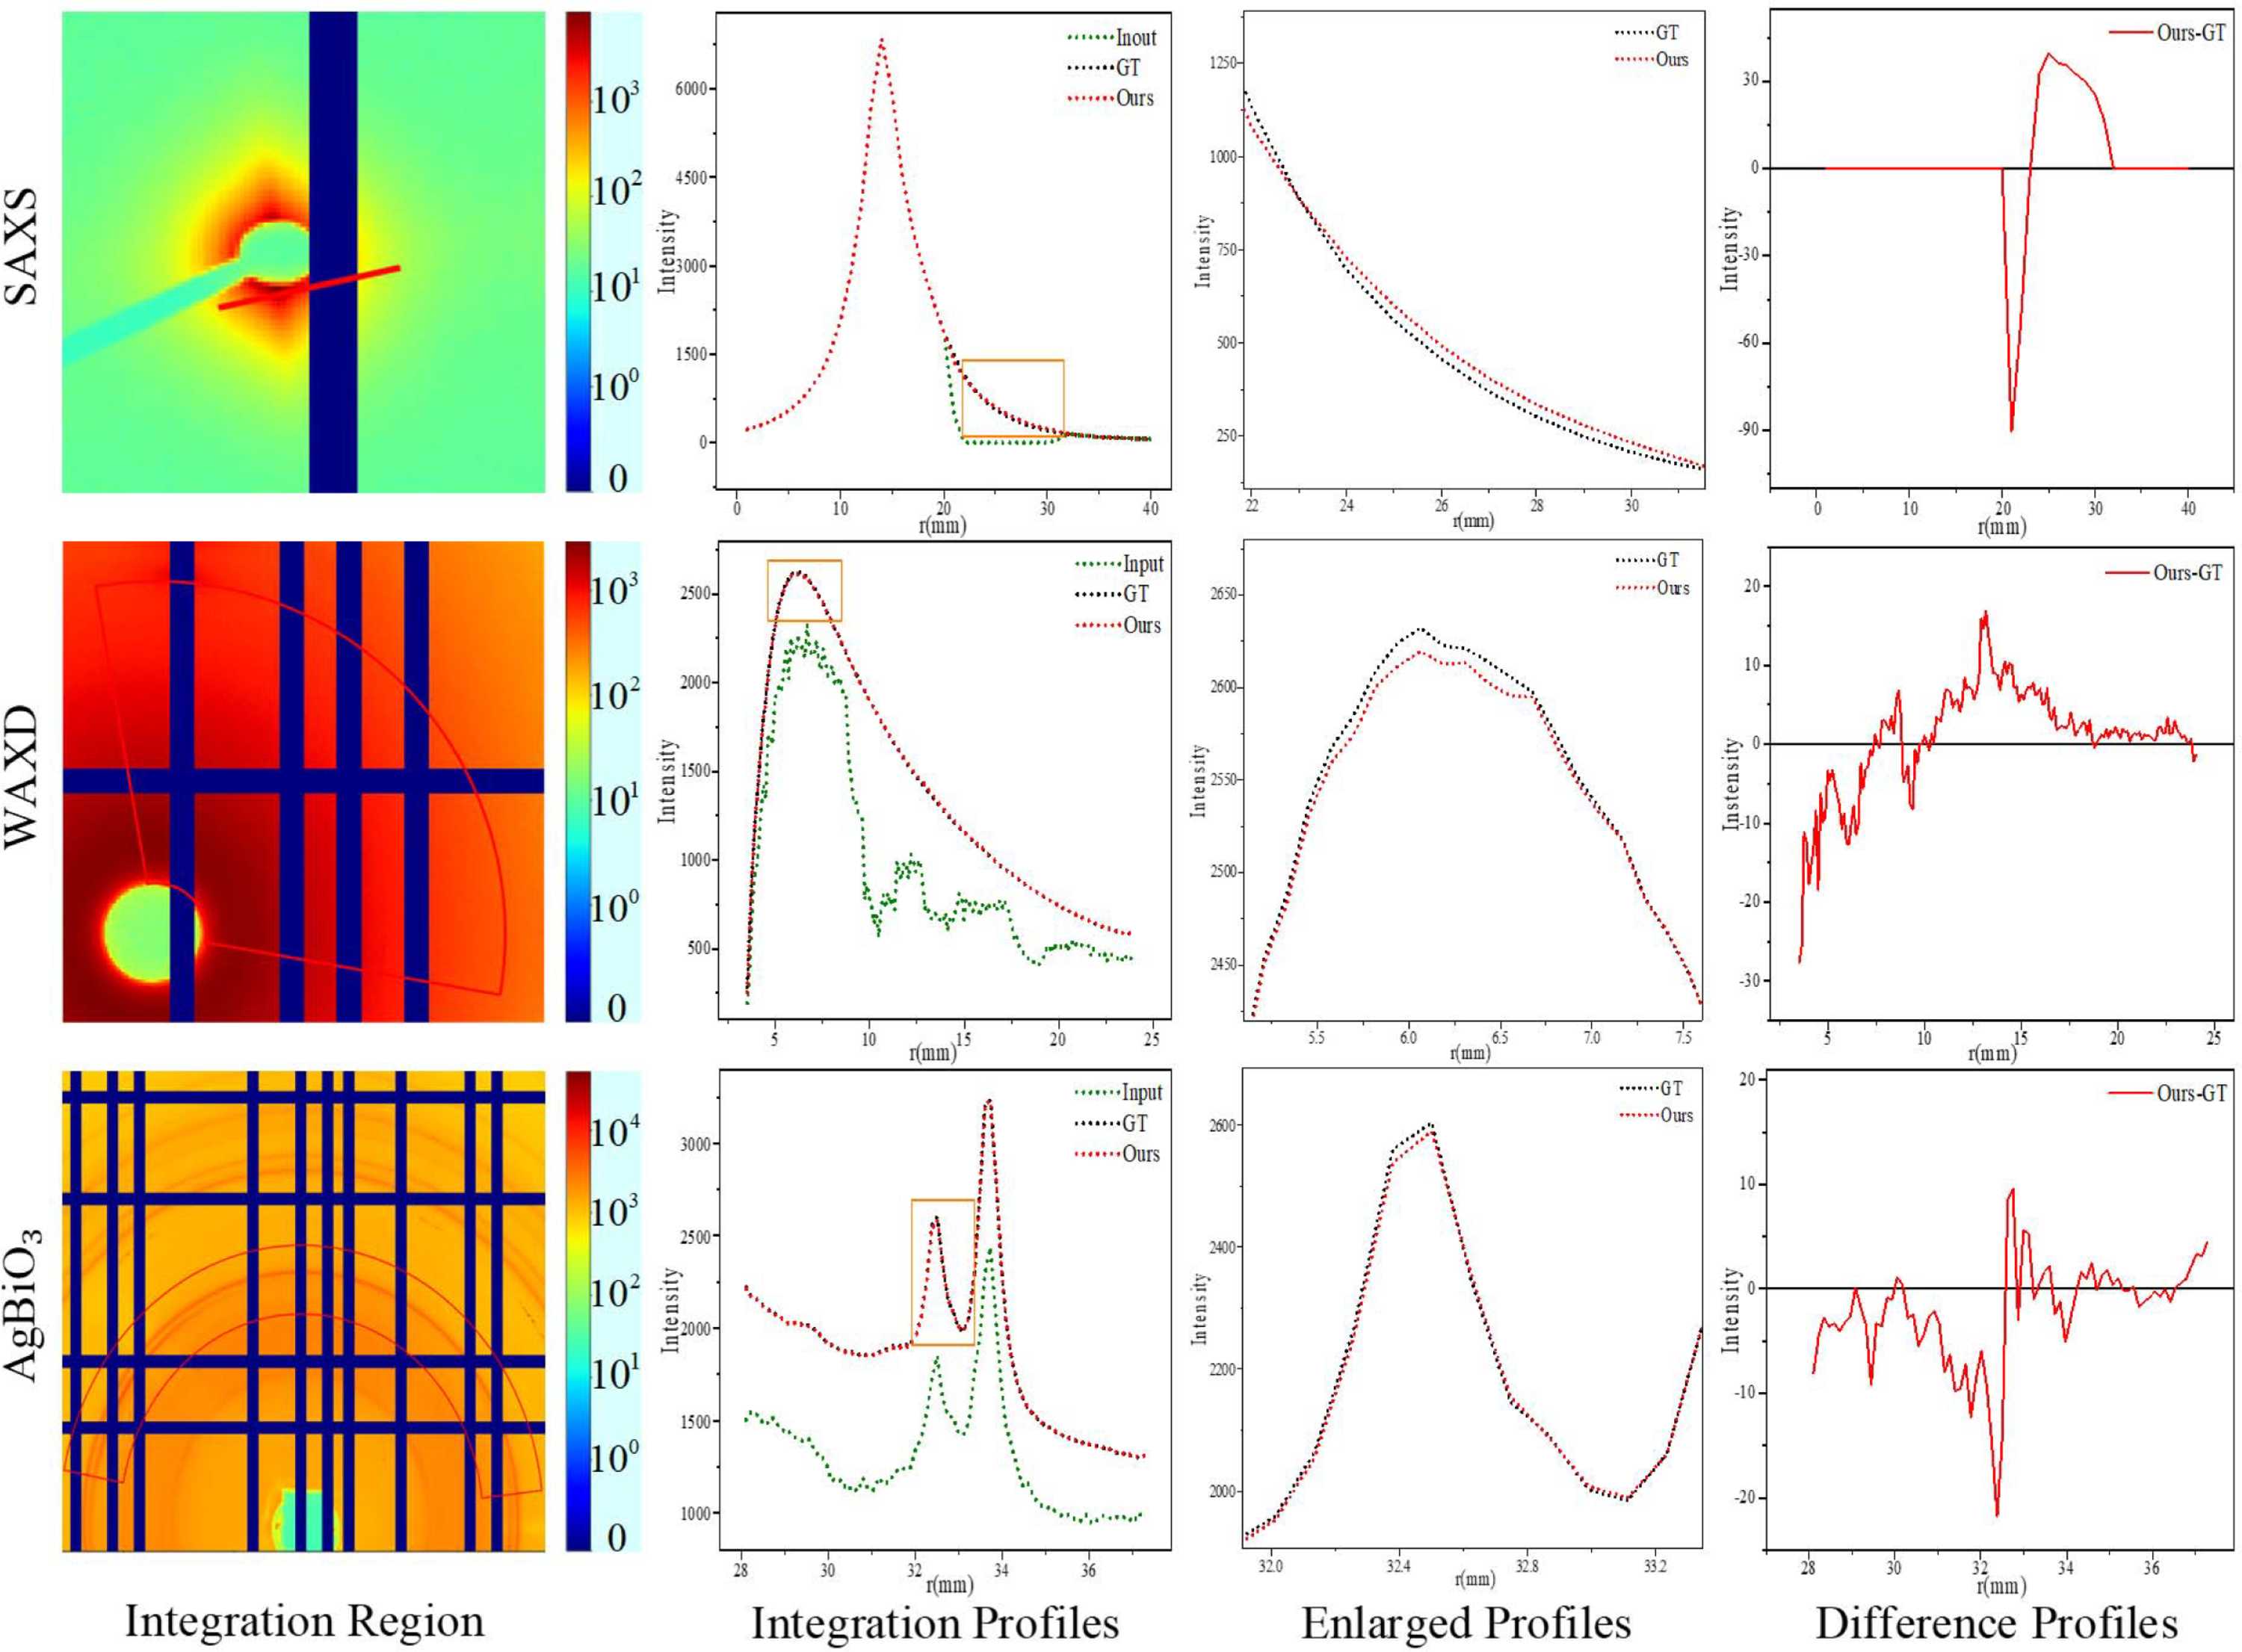
Figure 7
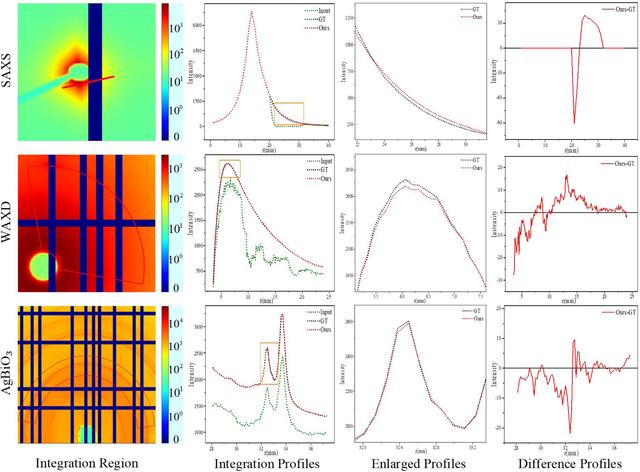
Integration Region shows magnified views of the integration regions corresponding to Fig. S4; Integration Profiles presents the corresponding integration profiles of the GT and TSINet; Enlarged Profiles provides enlarged views of the areas marked by the orange boxes in the Integration Profiles; and Difference Profiles illustrates the differences between the TSINet predictions and the GT. |
 | JOURNAL OF APPLIED CRYSTALLOGRAPHY |
ISSN: 1600-5767
 access