

 menu
|
|
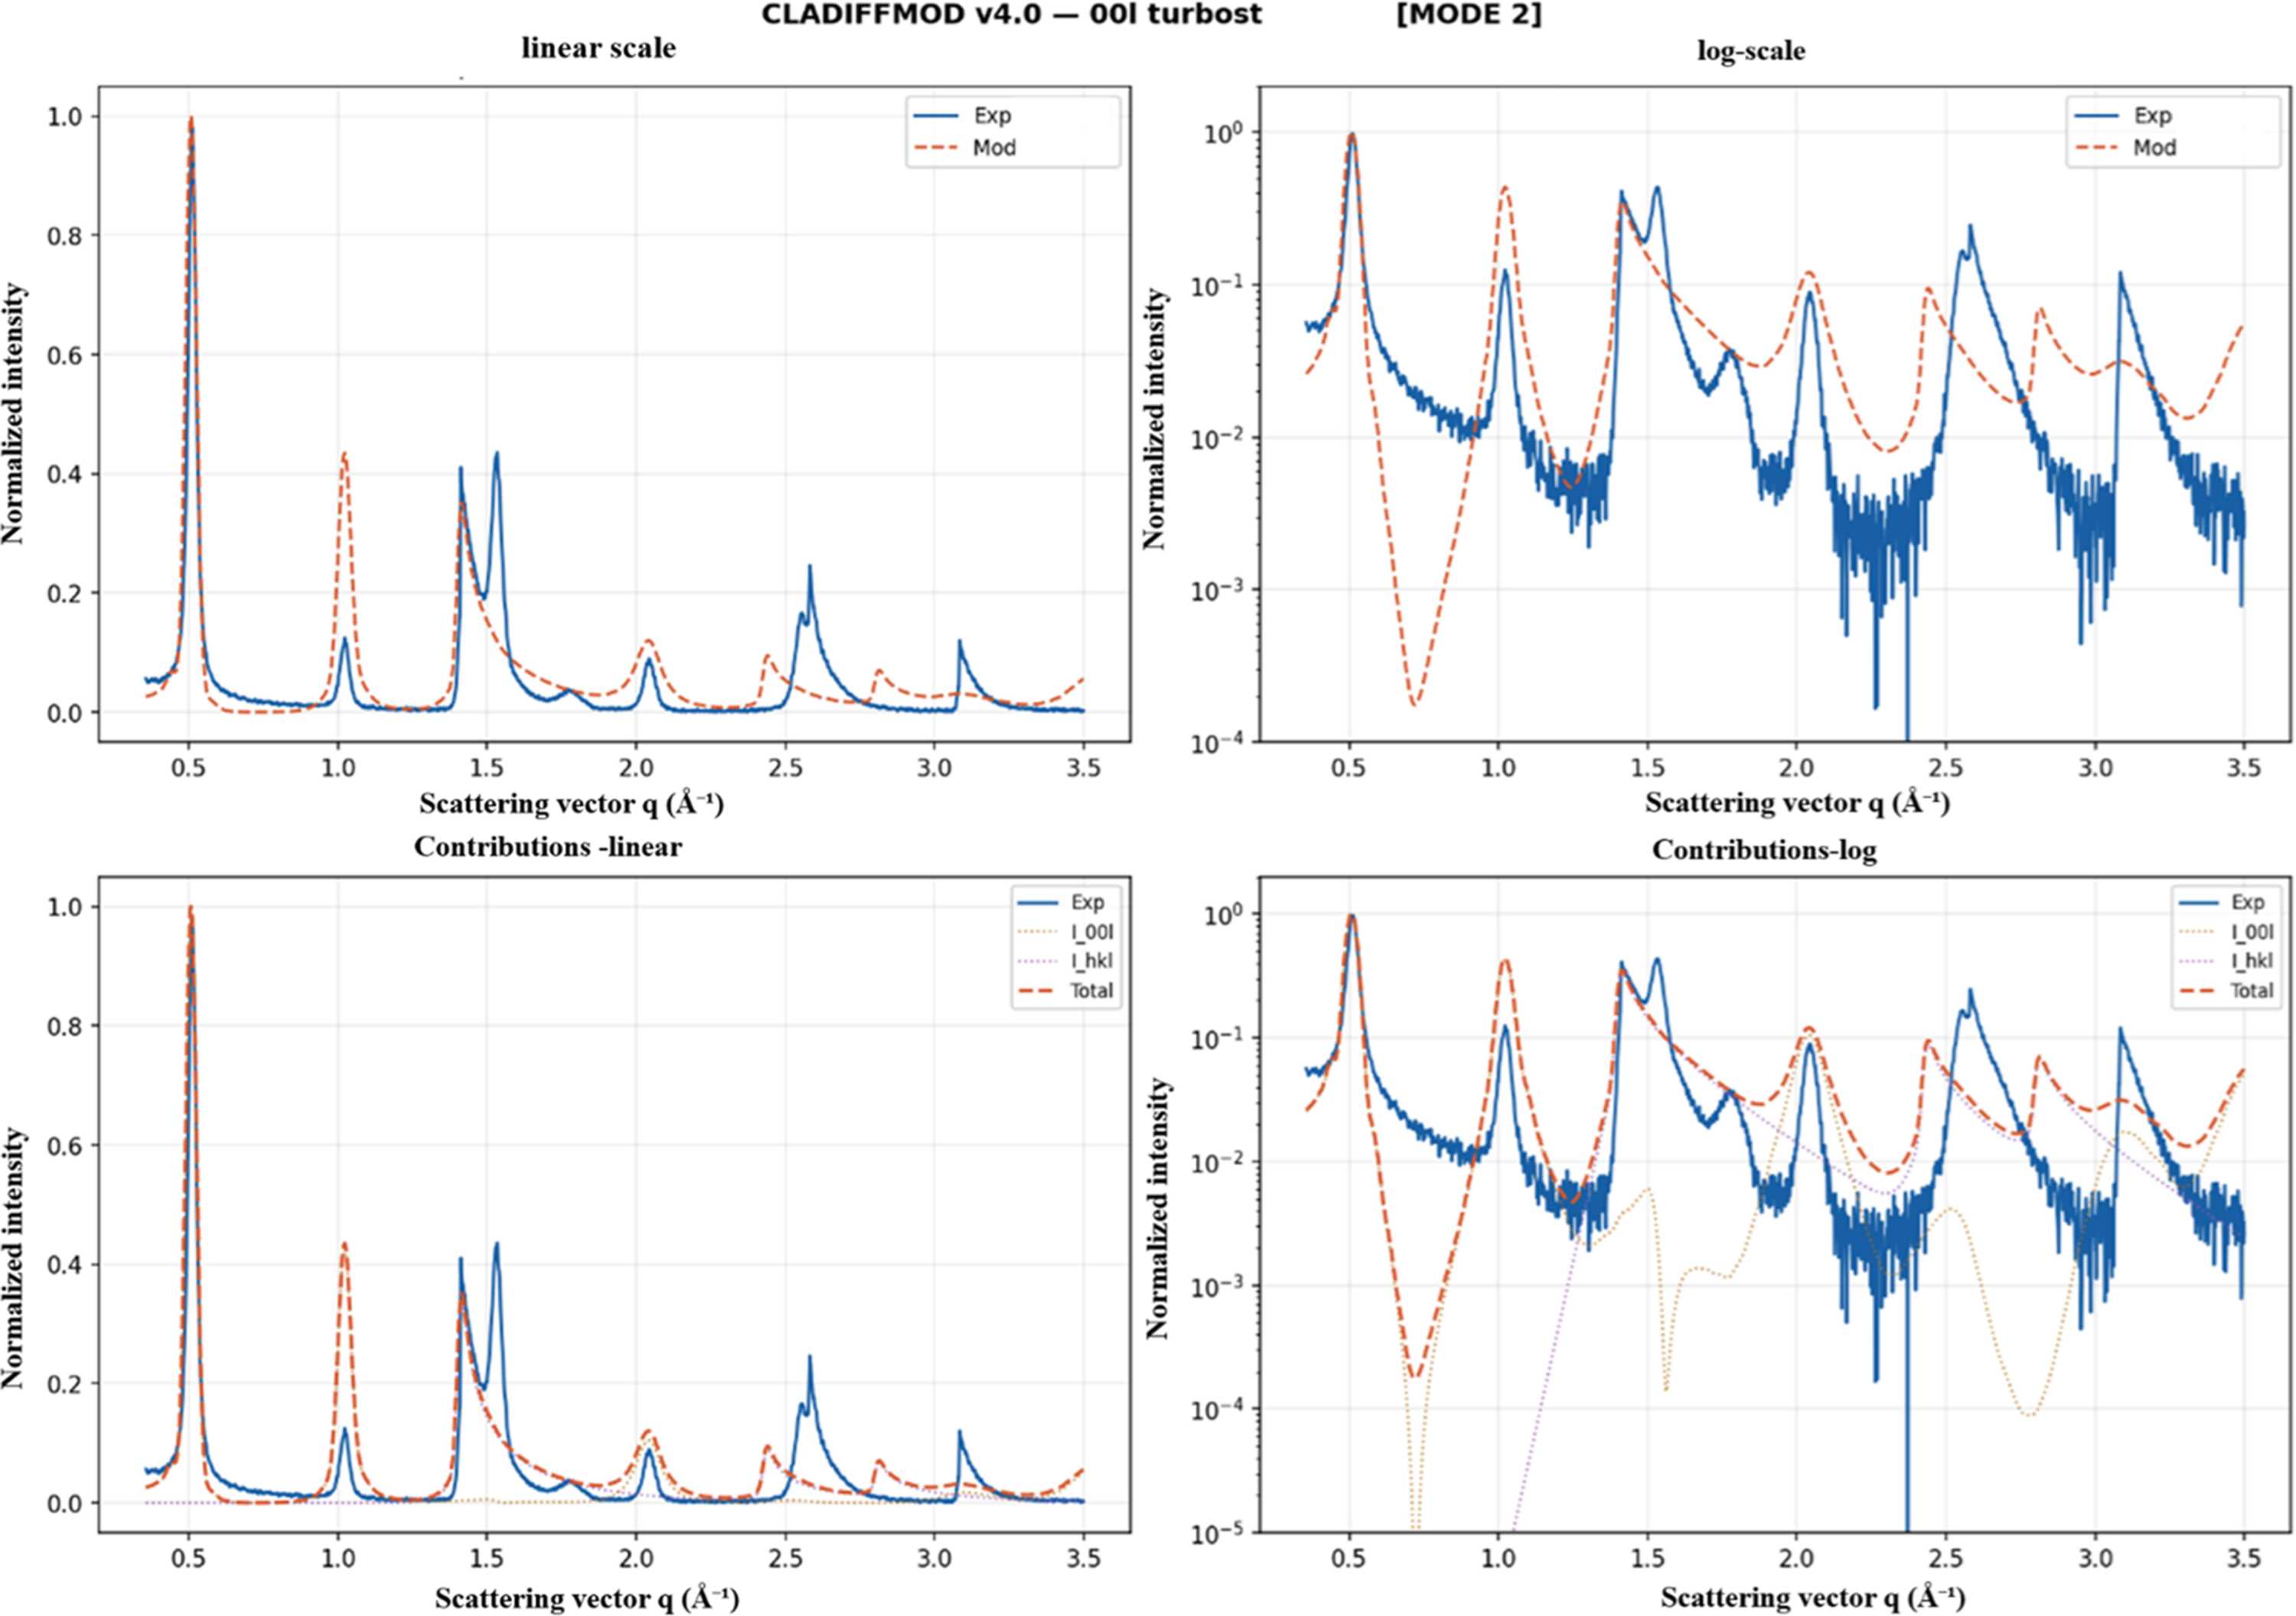
Figure 2
Experimental and calculated scattering intensities in the turbostratic hkl domain for the disordered powder configuration (S1). (Top panels) Comparison between experimental data (solid lines) and calculated total intensity (dashed lines) on linear (left) and logarithmic (right) scales. The main turbostratic band centred around q ≃ 1.4 Å−1 (  reflection) is reproduced in both position and overall envelope. (Bottom panels) Decomposition of the calculated intensity into basal 00l and turbostratic hkl contributions, shown in linear (left) and logarithmic (right) representations. The hkl component dominates the intermediate and high-q range, while the residual 00l contribution becomes negligible in the powder configuration. The Debye-based formulation (Poiarkova & Rehr, 1999  ; Gelisio & Scardi, 2016) captures the characteristic asymmetric profile of turbostratic scattering, although fine structural deviations remain visible in the logarithmic representation. These deviations are attributed to residual in-plane correlations and limitations of the isotropic Debye approximation. The overall agreement supports the use of a global in-plane disorder parameter (σr) and a fixed turbostratic weight (wturb) in subsequent analyses of oriented samples. |
 | JOURNAL OF APPLIED CRYSTALLOGRAPHY |
ISSN: 1600-5767
 access