

 menu
|
|
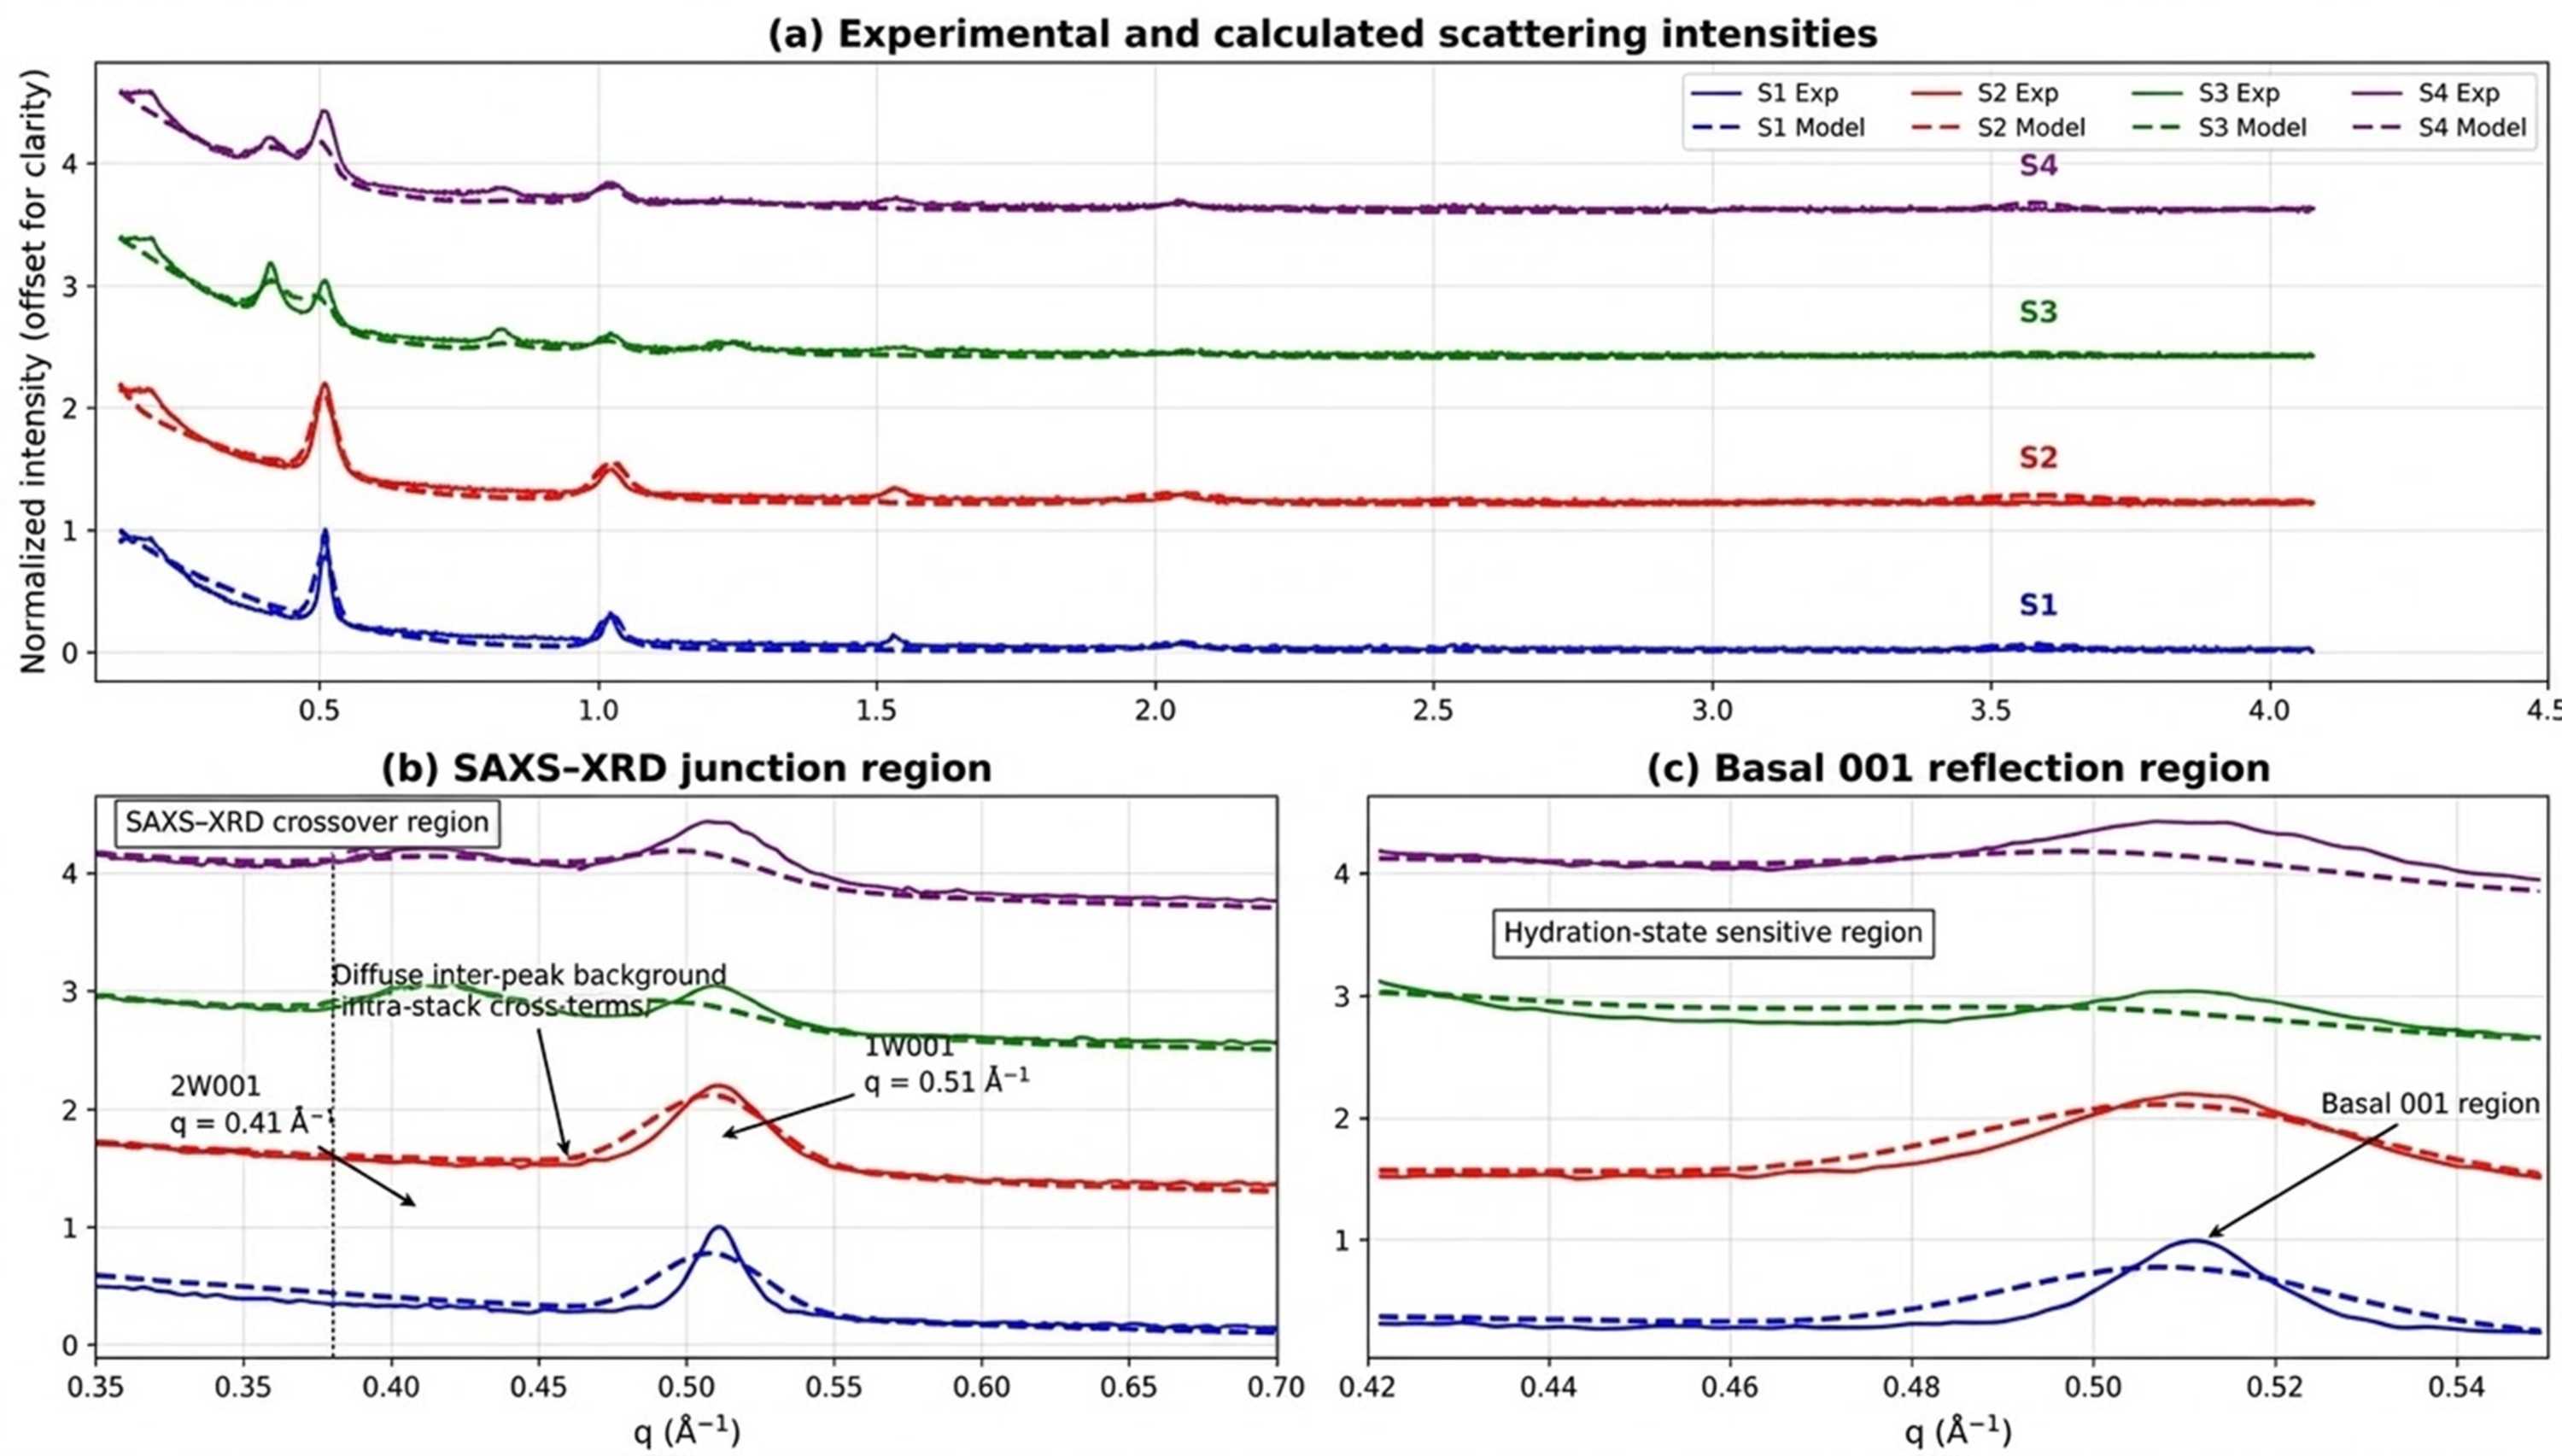
Figure 7
Multi-sample comparison between experimental and calculated scattering intensities for samples S1–S4. Experimental data (solid lines) and calculated profiles (dashed lines) are shown using a common normalization and vertical offset for clarity. (a) Global comparison over the full scattering range, illustrating the overall agreement between experiment and model for all samples. (b) Enlargement of the SAXS–XRD junction region (q ≃ 0.30–0.70 Å−1), highlighting the overlap between morphology-sensitive and stacking-sensitive scattering contributions. The positions of the 2W 001 and 1W 001 reflections and the diffuse inter-peak background are indicated. (c) Enlargement of the basal 001 reflection region (q ≃ 0.42–0.55 Å−1), illustrating the sensitivity of the model to hydration state and interstratification. Detailed logarithmic representations, physical decompositions of the calculated intensity and residual analyses are provided in Figs. S4–S6. |
 | JOURNAL OF APPLIED CRYSTALLOGRAPHY |
ISSN: 1600-5767
 access