

 menu
|
|
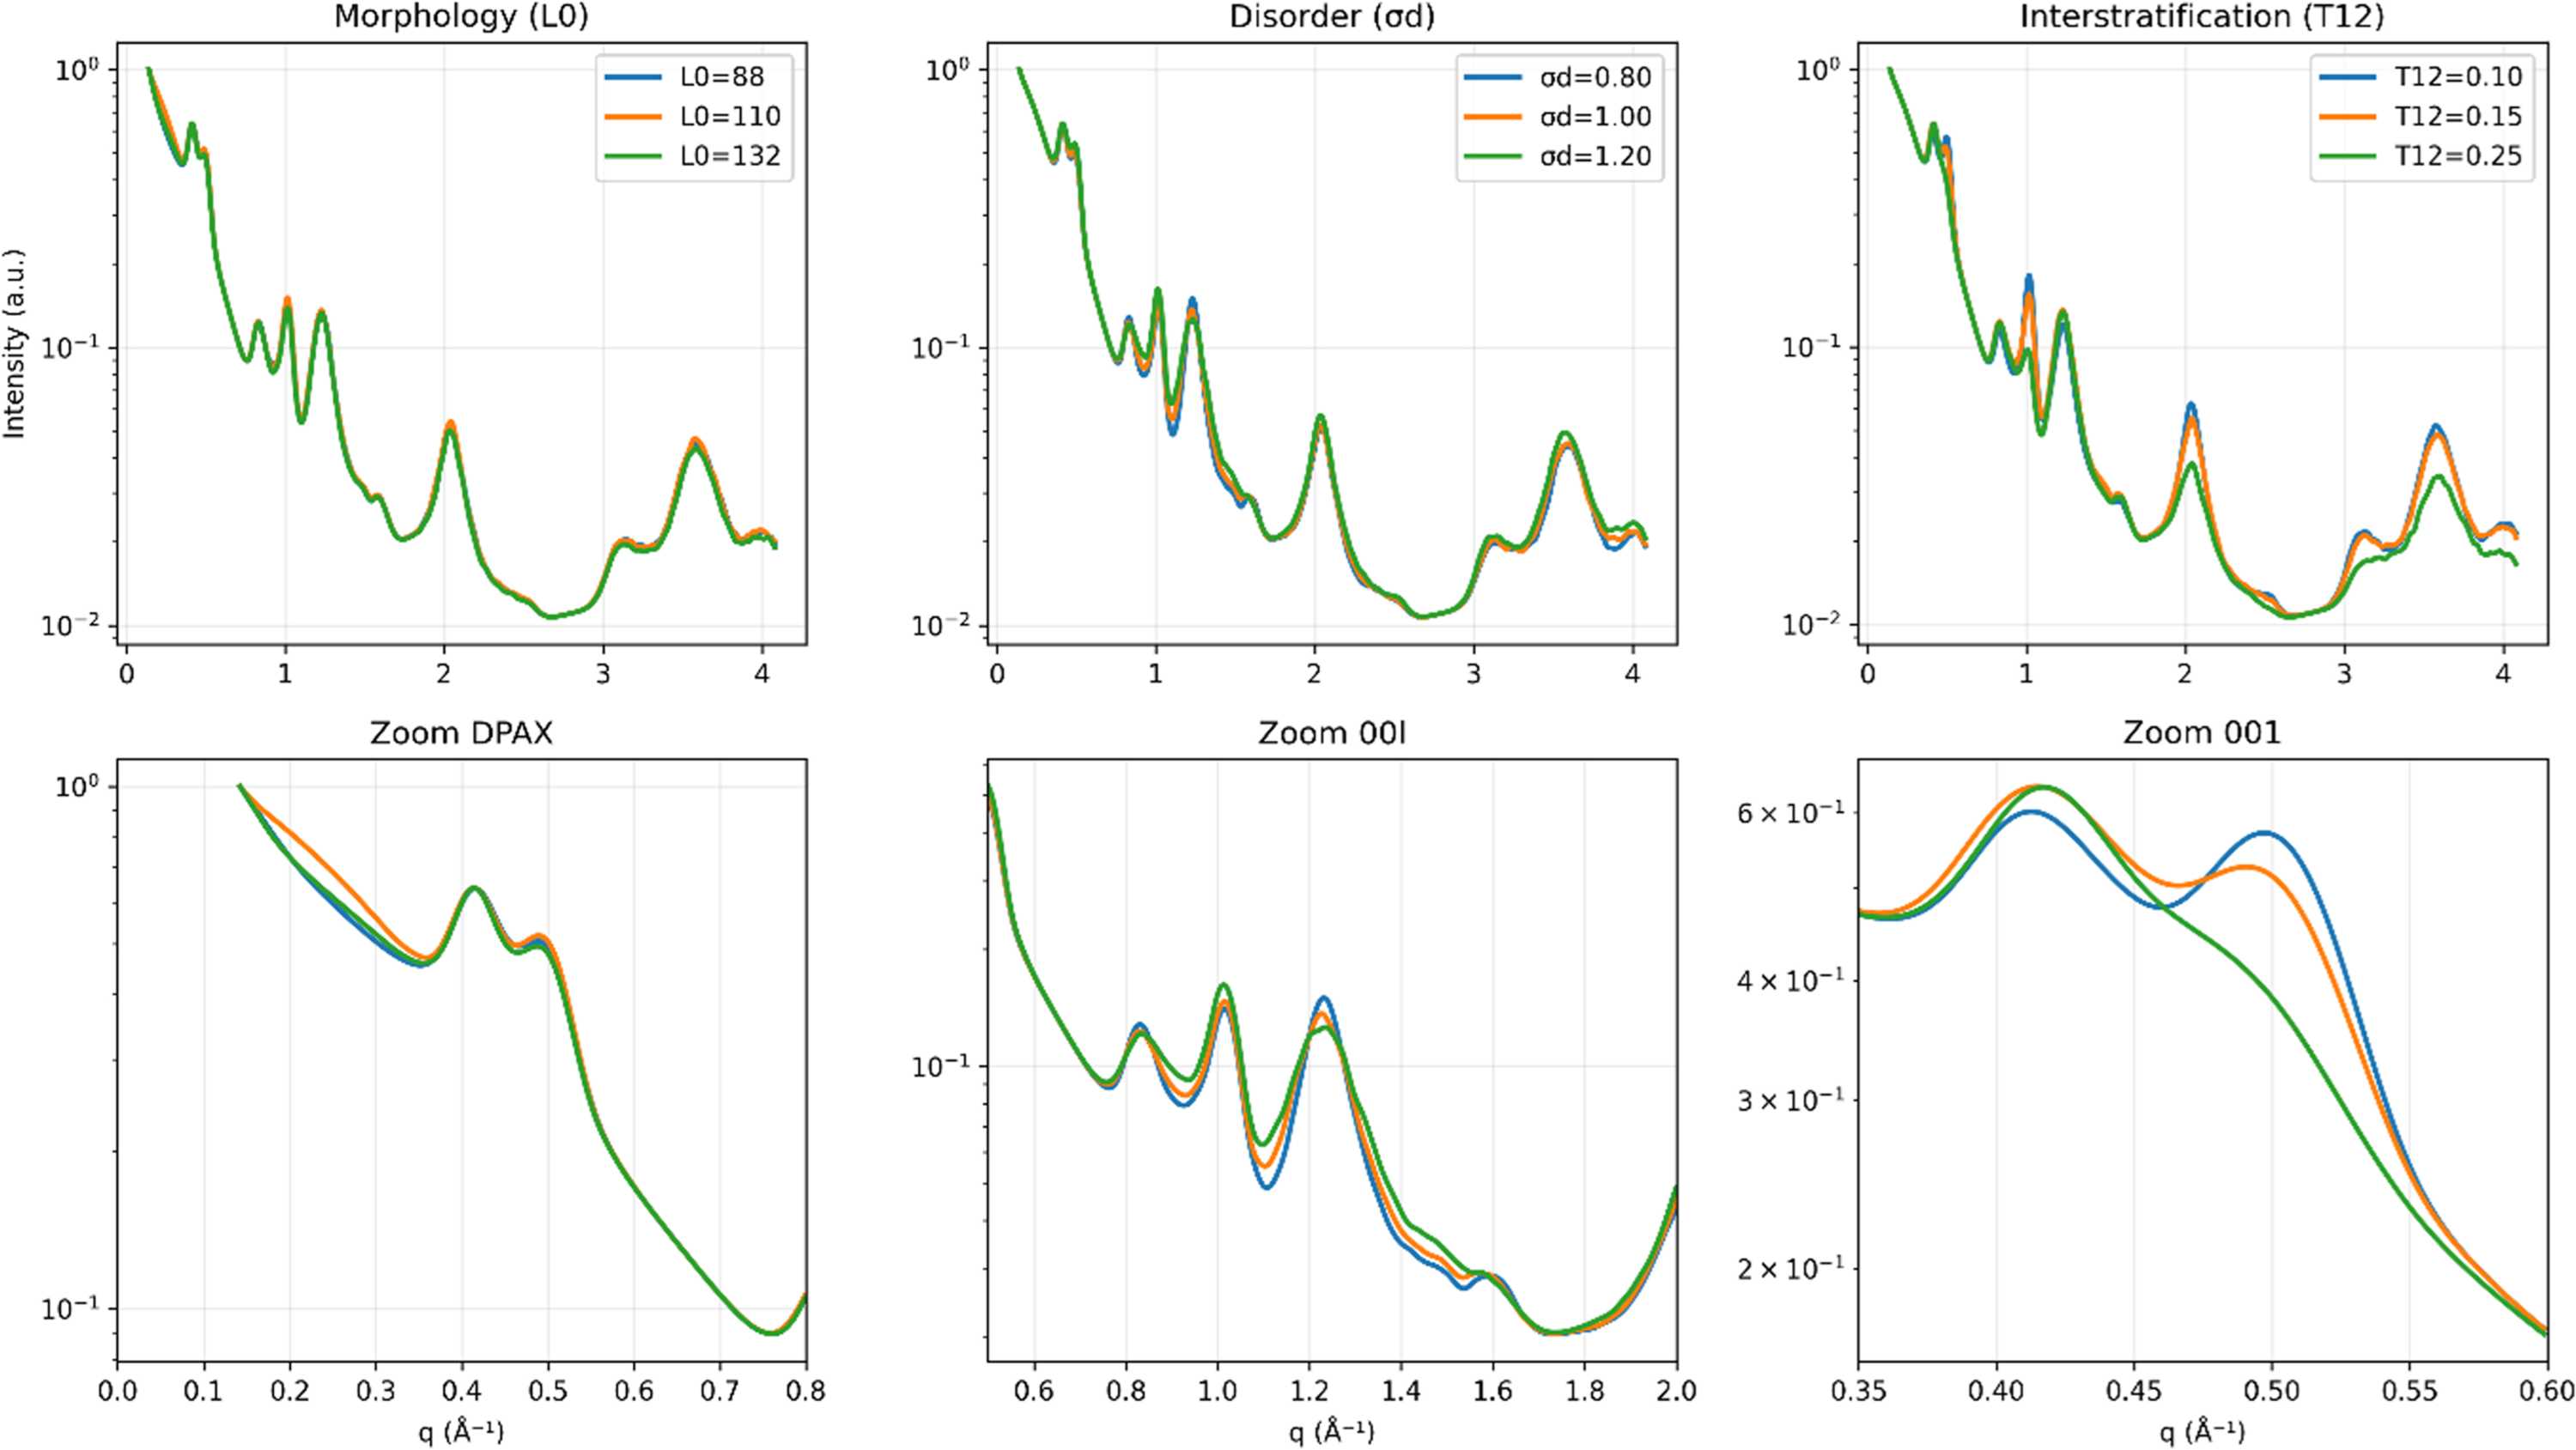
Figure 8
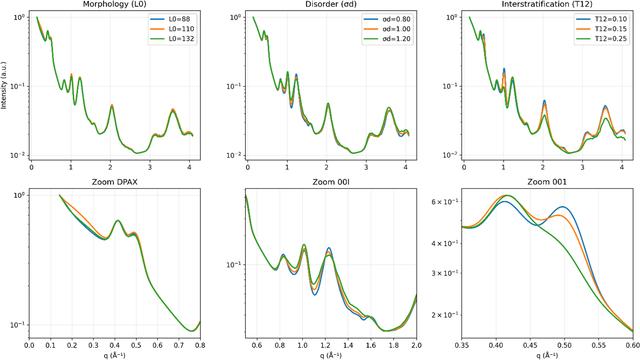
Sensitivity of the calculated scattering intensity to selected model parameters, evaluated around the S2 equilibrium configuration. (Top row) Full q range. (Bottom row) Corresponding enlargements of characteristic regions. (Left-hand column) Variation of platelet size (L0), primarily affecting the SAXS regime. (Middle column) Variation of interlayer spacing disorder (σd), controlling peak broadening in basal reflections. (Right-hand column) Variation of the Markov transition probability (T12), modifying the shape of the 001 region. The localized response of the intensity demonstrates limited parameter degeneracy. |
 | JOURNAL OF APPLIED CRYSTALLOGRAPHY |
ISSN: 1600-5767
 access