

 menu
|
|
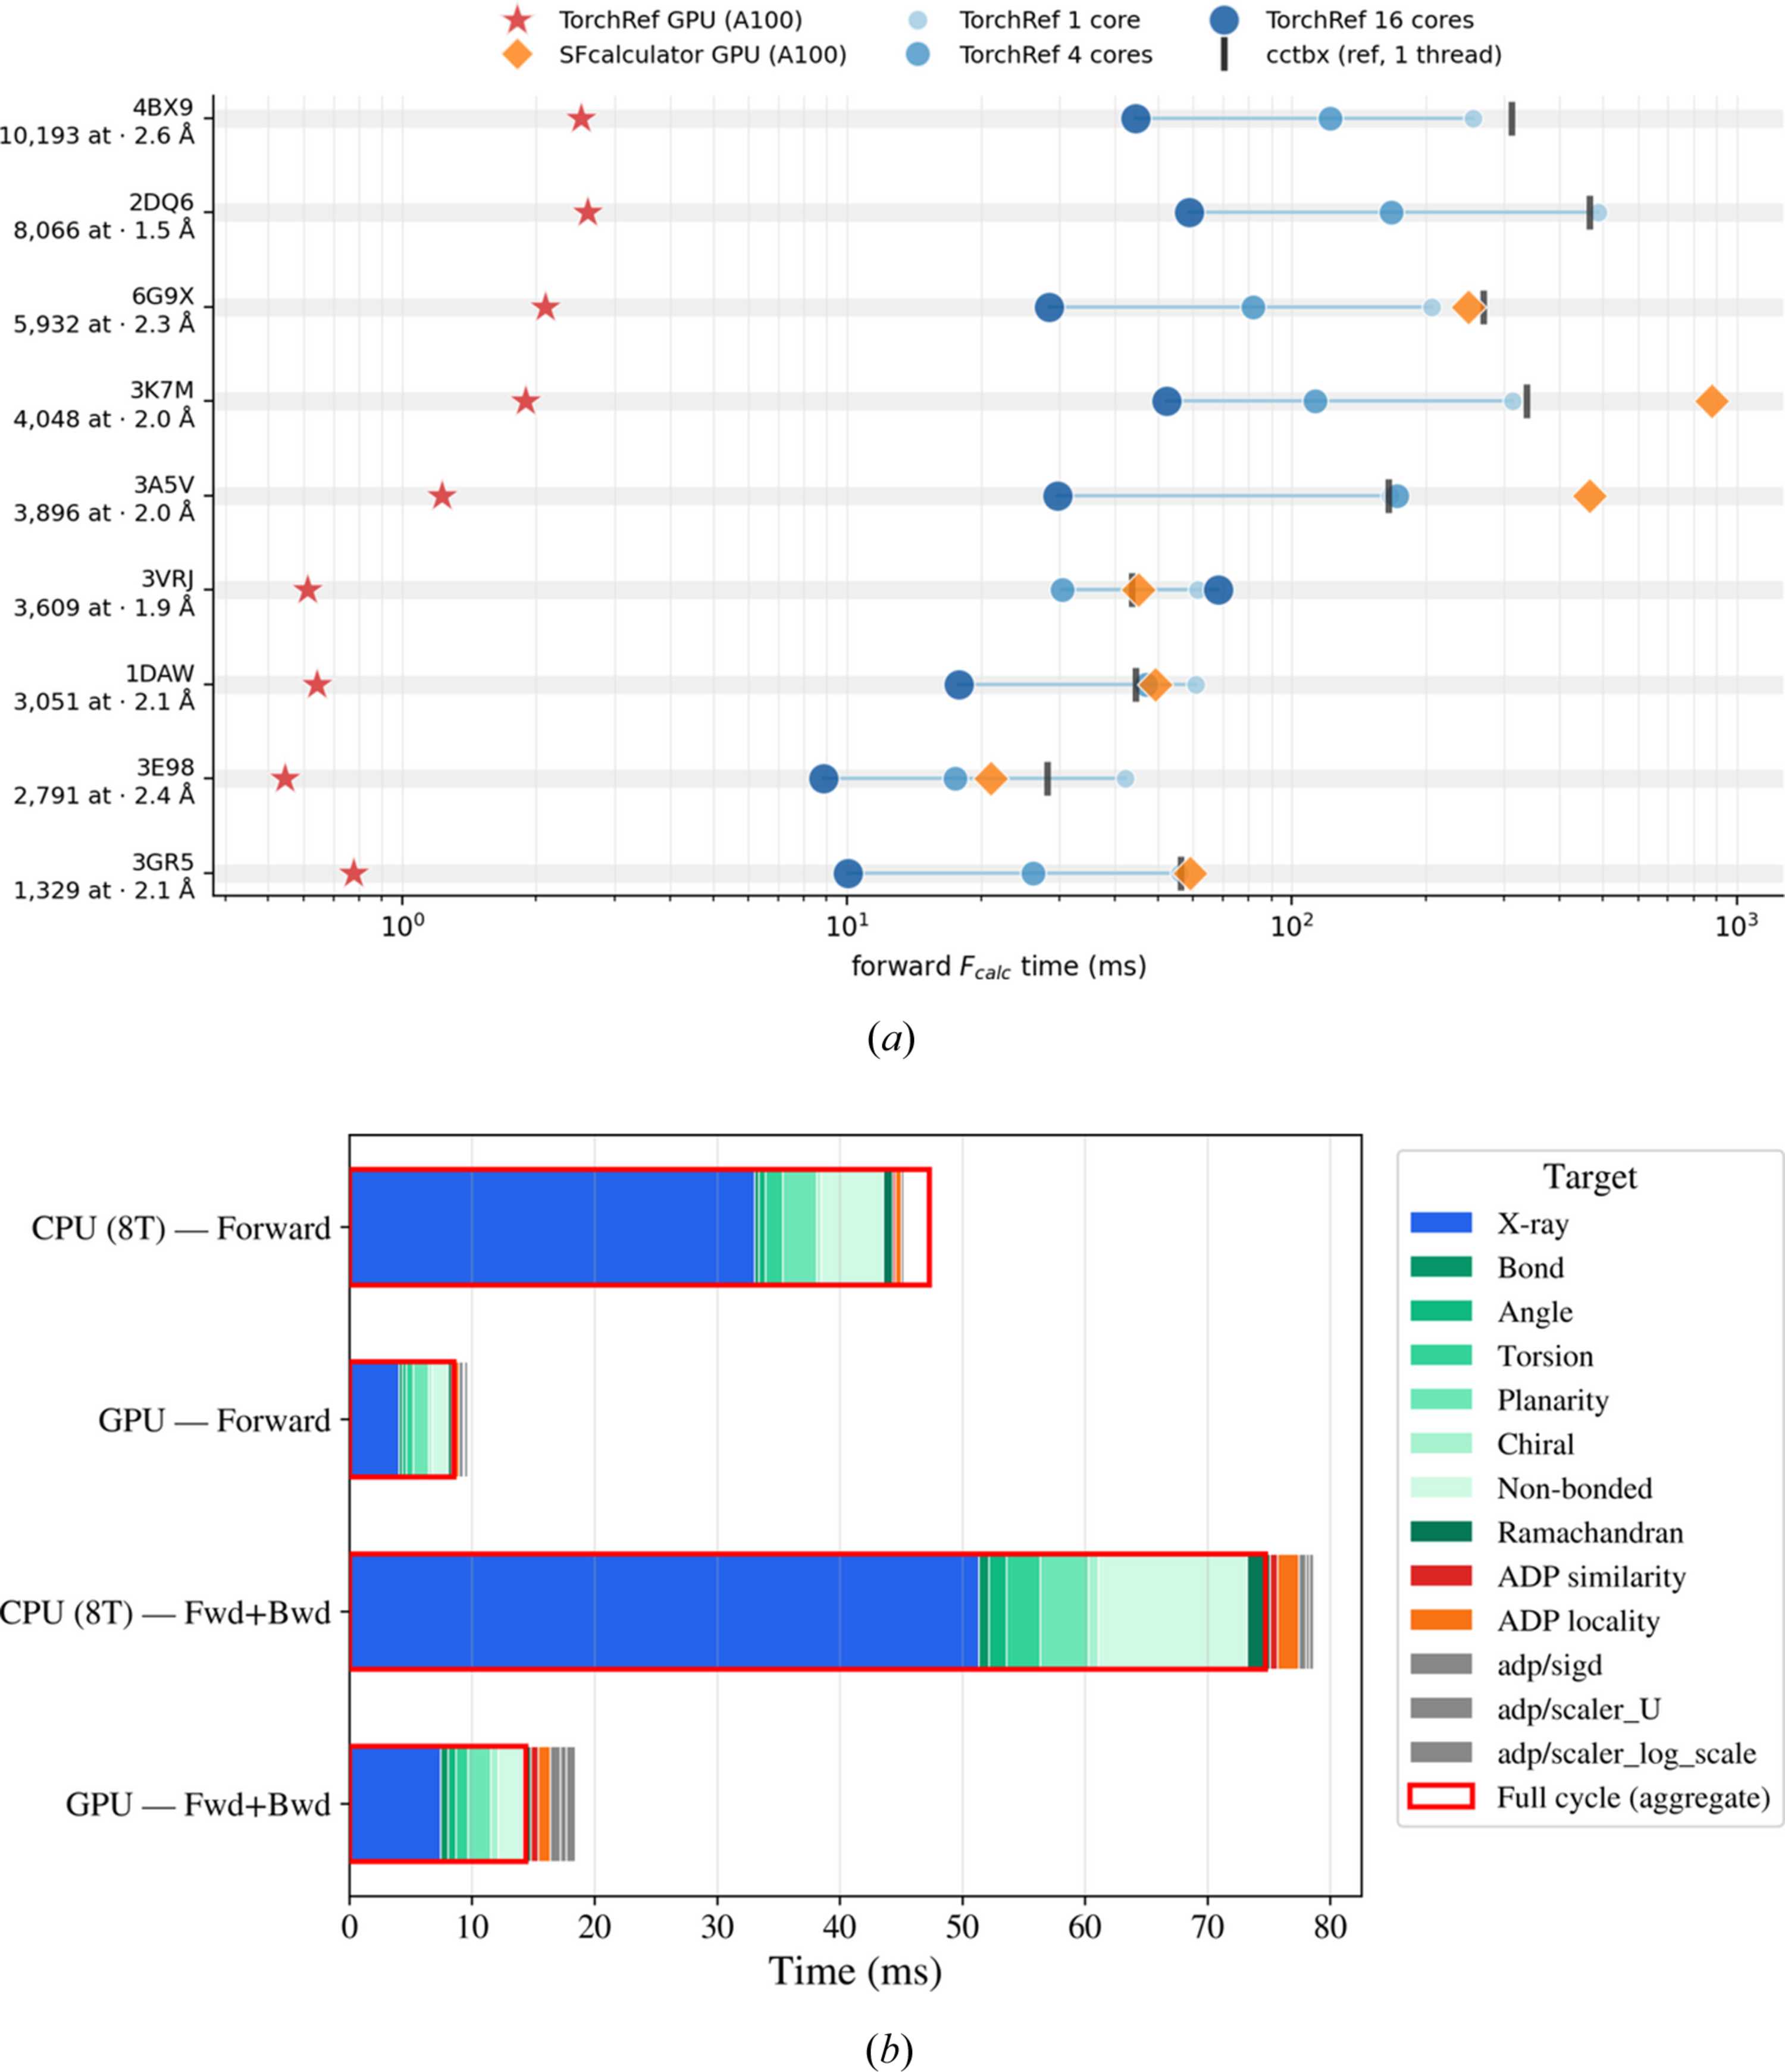
Figure 3
Structure factor and refinement-cycle performance. GPU timings were recorded on an NVIDIA A100 40 GB and CPU and CCTBX timings on an Intel Xeon 6230R (Cascade Lake), chosen to be generation-matched to the A100. (a) Forward  time across nine benchmark structures (one row each, labelled by atom count and resolution; log scale), comparing TorchRef on the GPU (red stars) and on 1/4/16 CPU cores (light-to-dark blue circles) against SFCalculator on the GPU (orange diamonds) and CCTBX on a single CPU thread (black ticks, reference). TorchRef matches CCTBX on a single core and overtakes it at four cores; on the GPU it is a median 124-fold faster than CCTBX (52–179-fold across the set). SFCalculator's direct-summation GPU path is one to two orders of magnitude slower than TorchRef's GPU kernel and is absent for the two largest structures, where it runs out of memory. (b) Per-target time breakdown of a refinement cycle for pdb_00001daw (3051 atoms, 23356 reflections,  = 2.05 Å) on CPU (eight threads) and GPU, for the forward pass and the full forward + backward pass. Stacked bars show the individually timed targets: the X-ray target dominates, and the hollow red box is the independently measured full cycle. A full forward + backward cycle takes ∼14 ms on the GPU and ∼75 ms on eight CPU cores. |
 | JOURNAL OF APPLIED CRYSTALLOGRAPHY |
ISSN: 1600-5767
 access