

 menu
|
|
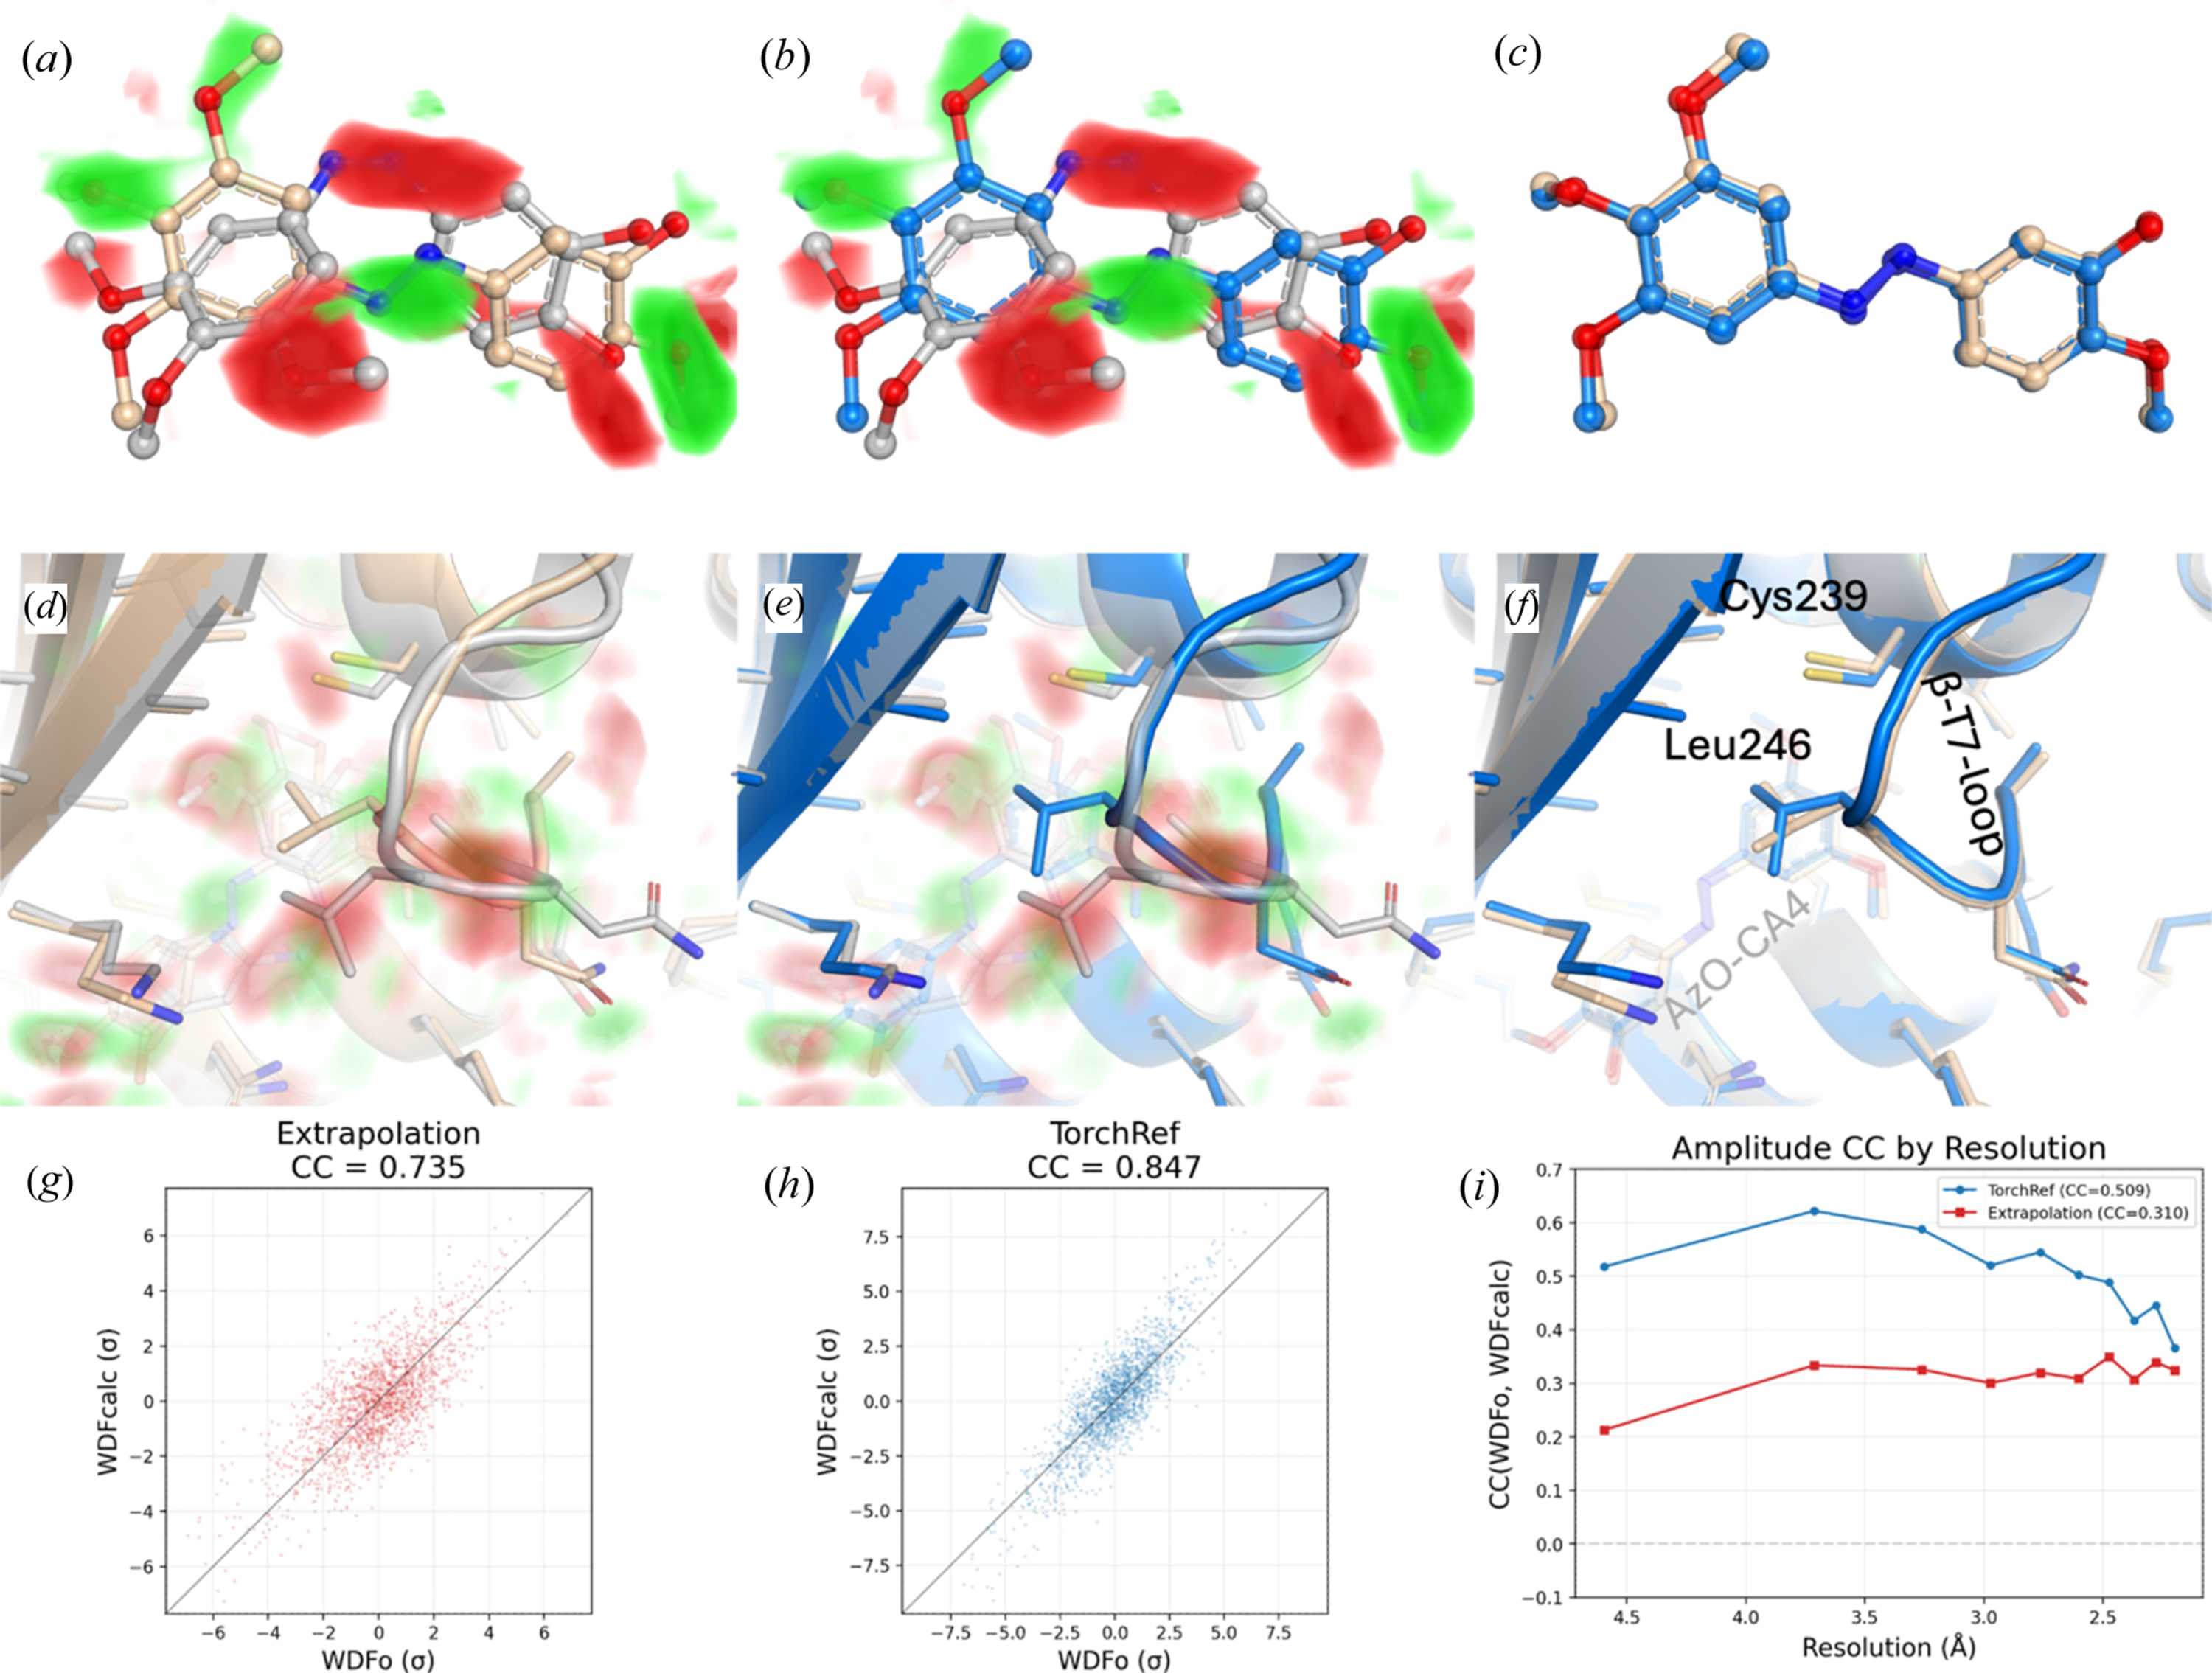
Figure 4
Difference refinement of azo-CA4 (IBL) cis-to-trans isomerization in tubulin (pdb_00007yyz). Weighted difference electron-density (WDFo) maps are visualized via a volume ramp from 3 to 5σ around the ligand (green, positive; red, negative) (a, b) and 2.5 to 4.5σ in the wider binding pocket (d, e). Top row (a–c): IBL ligand close-up. Bottom row (d–f): binding pocket view showing the changes in the βt7-loop resulting from the unbinding of the trans conformer ligand. Dark-state structure pdb_00008ql2 (grey), published extrapolated structure pdb_00007yyz (wheat) and TorchRef difference-refined structure (blue). (a, d) WDFo map with the deposited pdb_00007yyz structure refined from extrapolated structure factors. (b, e) WDFo map with the TorchRef difference-refined structure. (c, f) Superposition of the TorchRef-refined (blue) and deposited pdb_00007yyz (wheat) conformations, showing the agreement and differences between the independently determined light-state structures. Scatter plots (g) and (h) show the distribution of WDFc voxel values relative to WDFo voxels within a 2.5 Å radius around the dark and light conformations of the ligand. (g) shows the scatter plot for the extrapolated data, while (h) shows the TorchRef difference-refinement scatter plot. The correlation between calculated and observed difference amplitudes is shown in panel (i), binned by resolution. |
 | JOURNAL OF APPLIED CRYSTALLOGRAPHY |
ISSN: 1600-5767
 access