

 menu
|
|
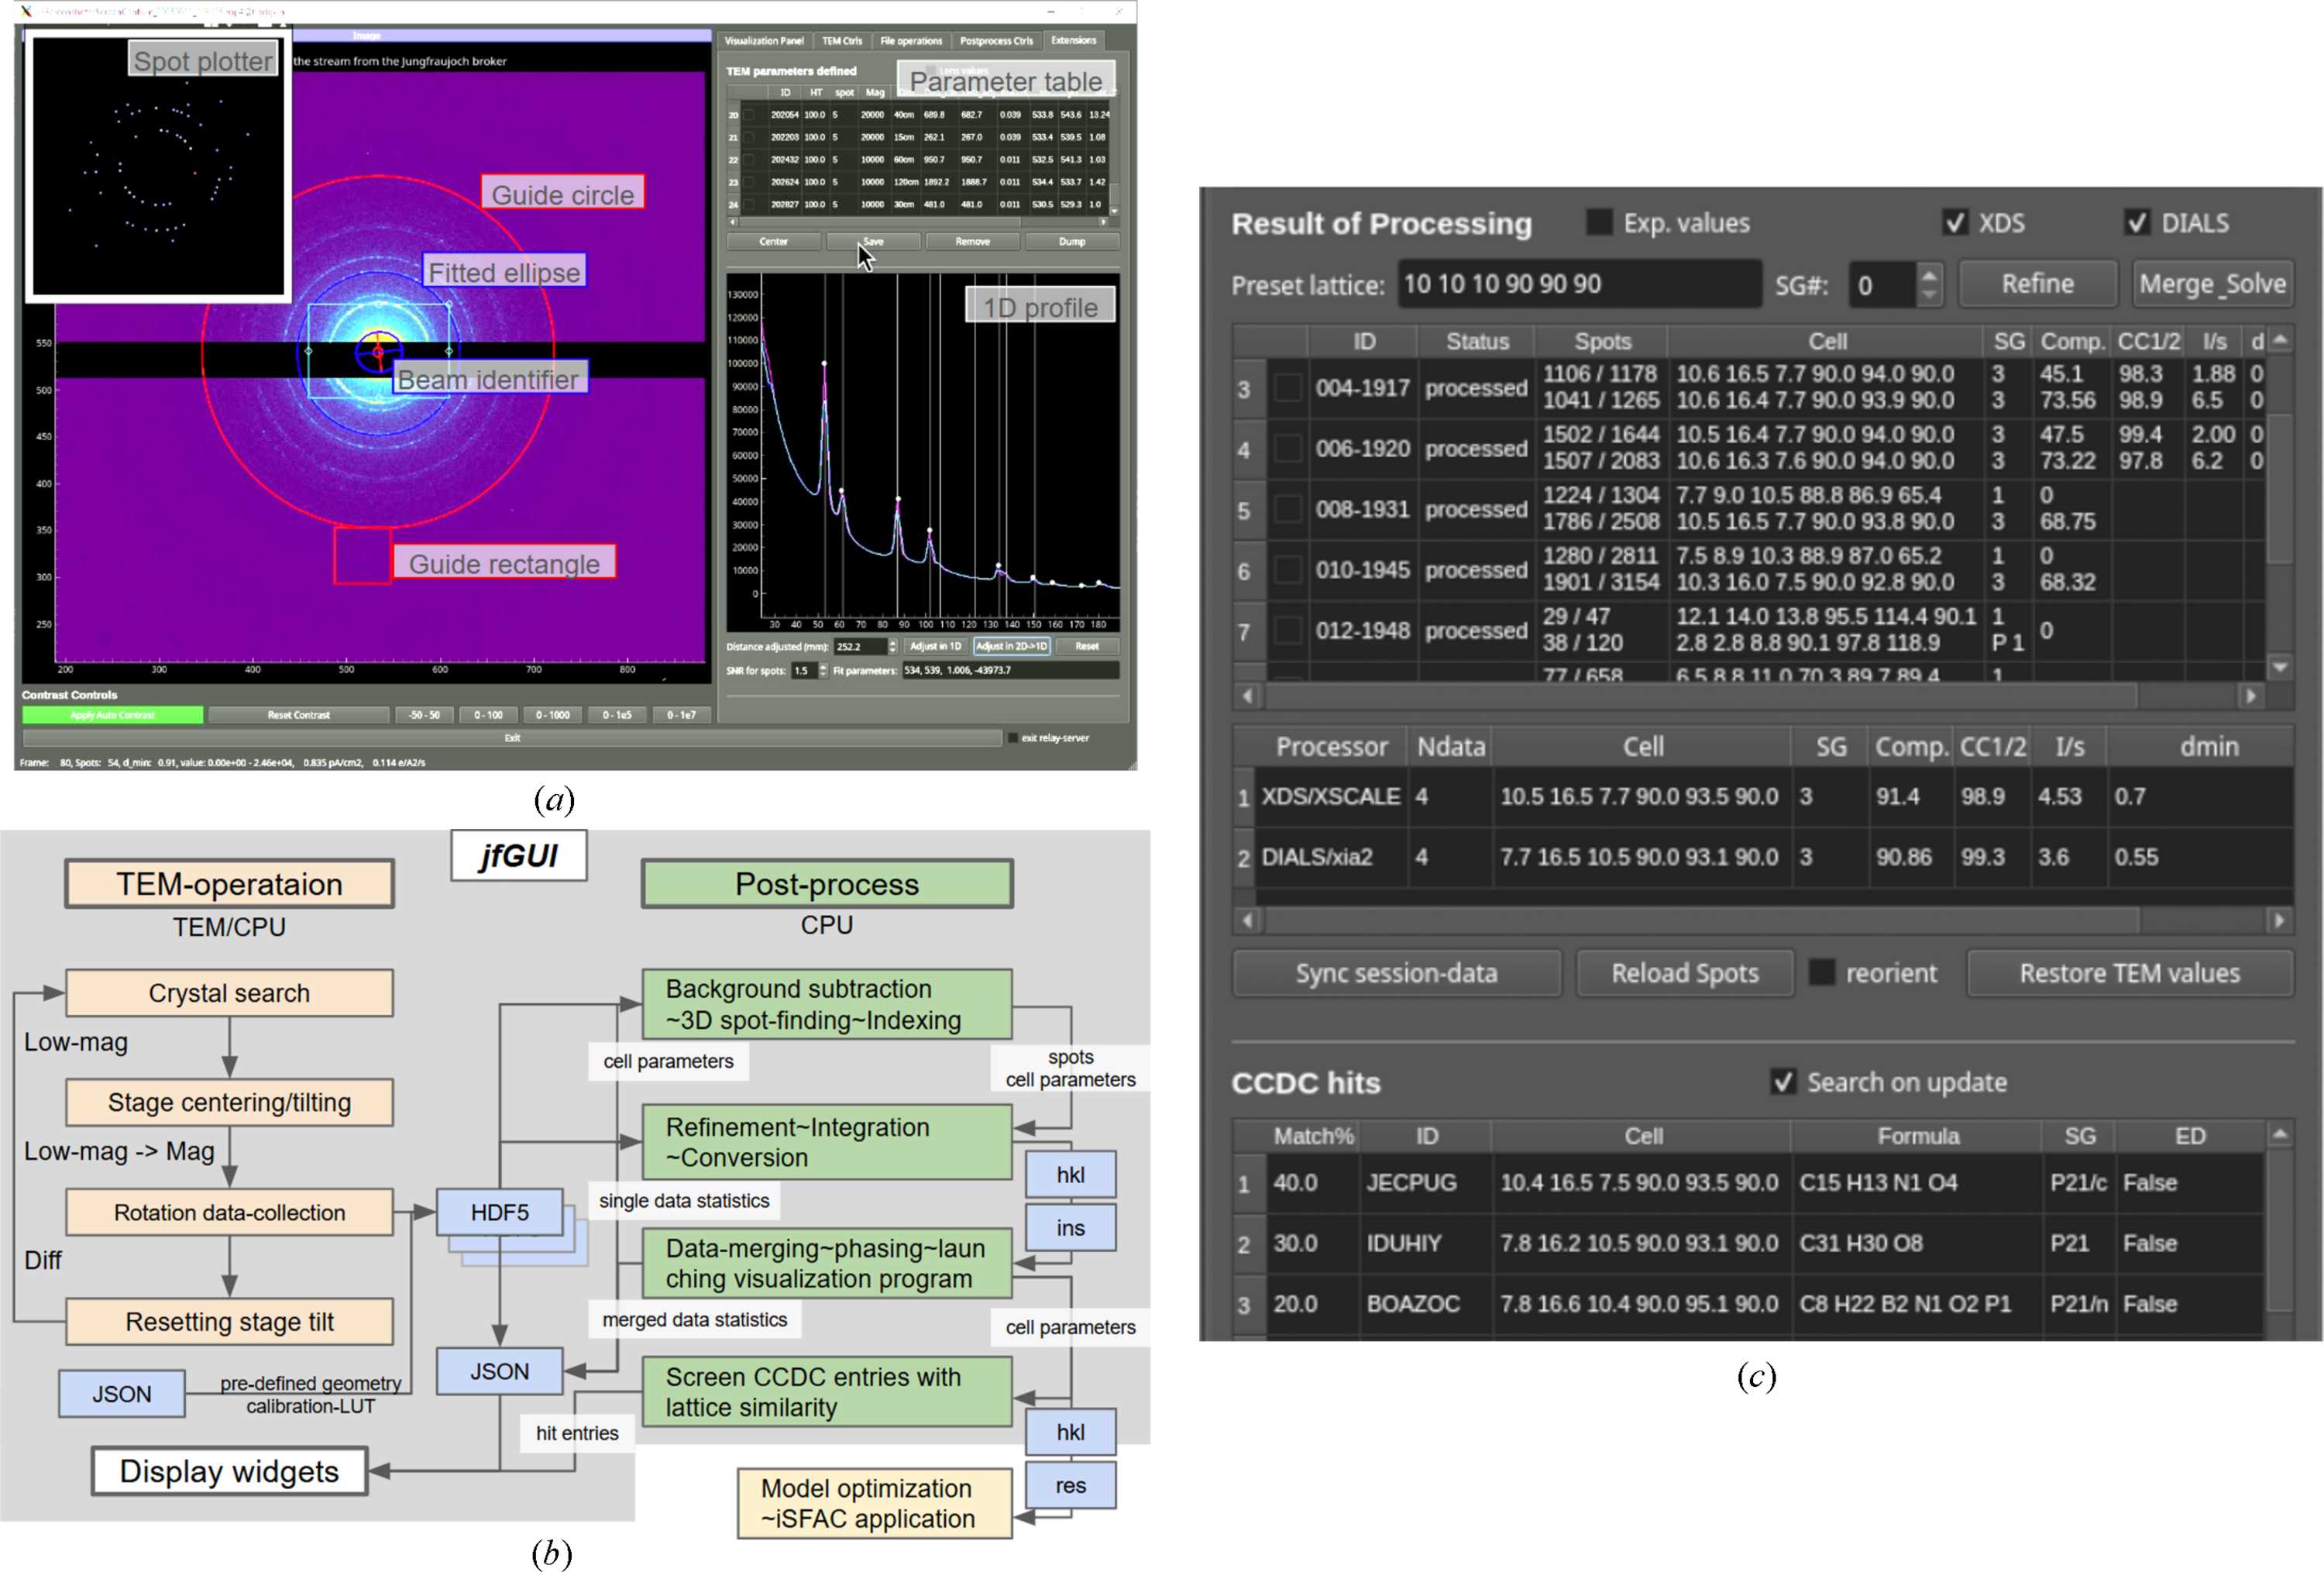
Figure 2
JFGui features and data-processing workflow. (a) Calibration measurement interface showing beam and magnification evaluation; labels with gray background are external annotations. A guide rectangle is used for centering between LowMAG and MAG modes. (b) Flow chart summarizing the data-collection and processing workflow; gray-shaded steps are directly controllable through the GUI. (c) Representative display of multiple datasets collected and merged. Results from XDS and DIALS appear in paired rows of the top table. After several datasets have been collected, data-merging can start, and the output is shown in the middle table. If CCDC depositions with similar lattice parameters to the determined ones are identified, they are listed in the bottom table. The matches in the ELECTRON subset are checked. |
 | JOURNAL OF APPLIED CRYSTALLOGRAPHY |
ISSN: 1600-5767
 access