

 menu
|
|
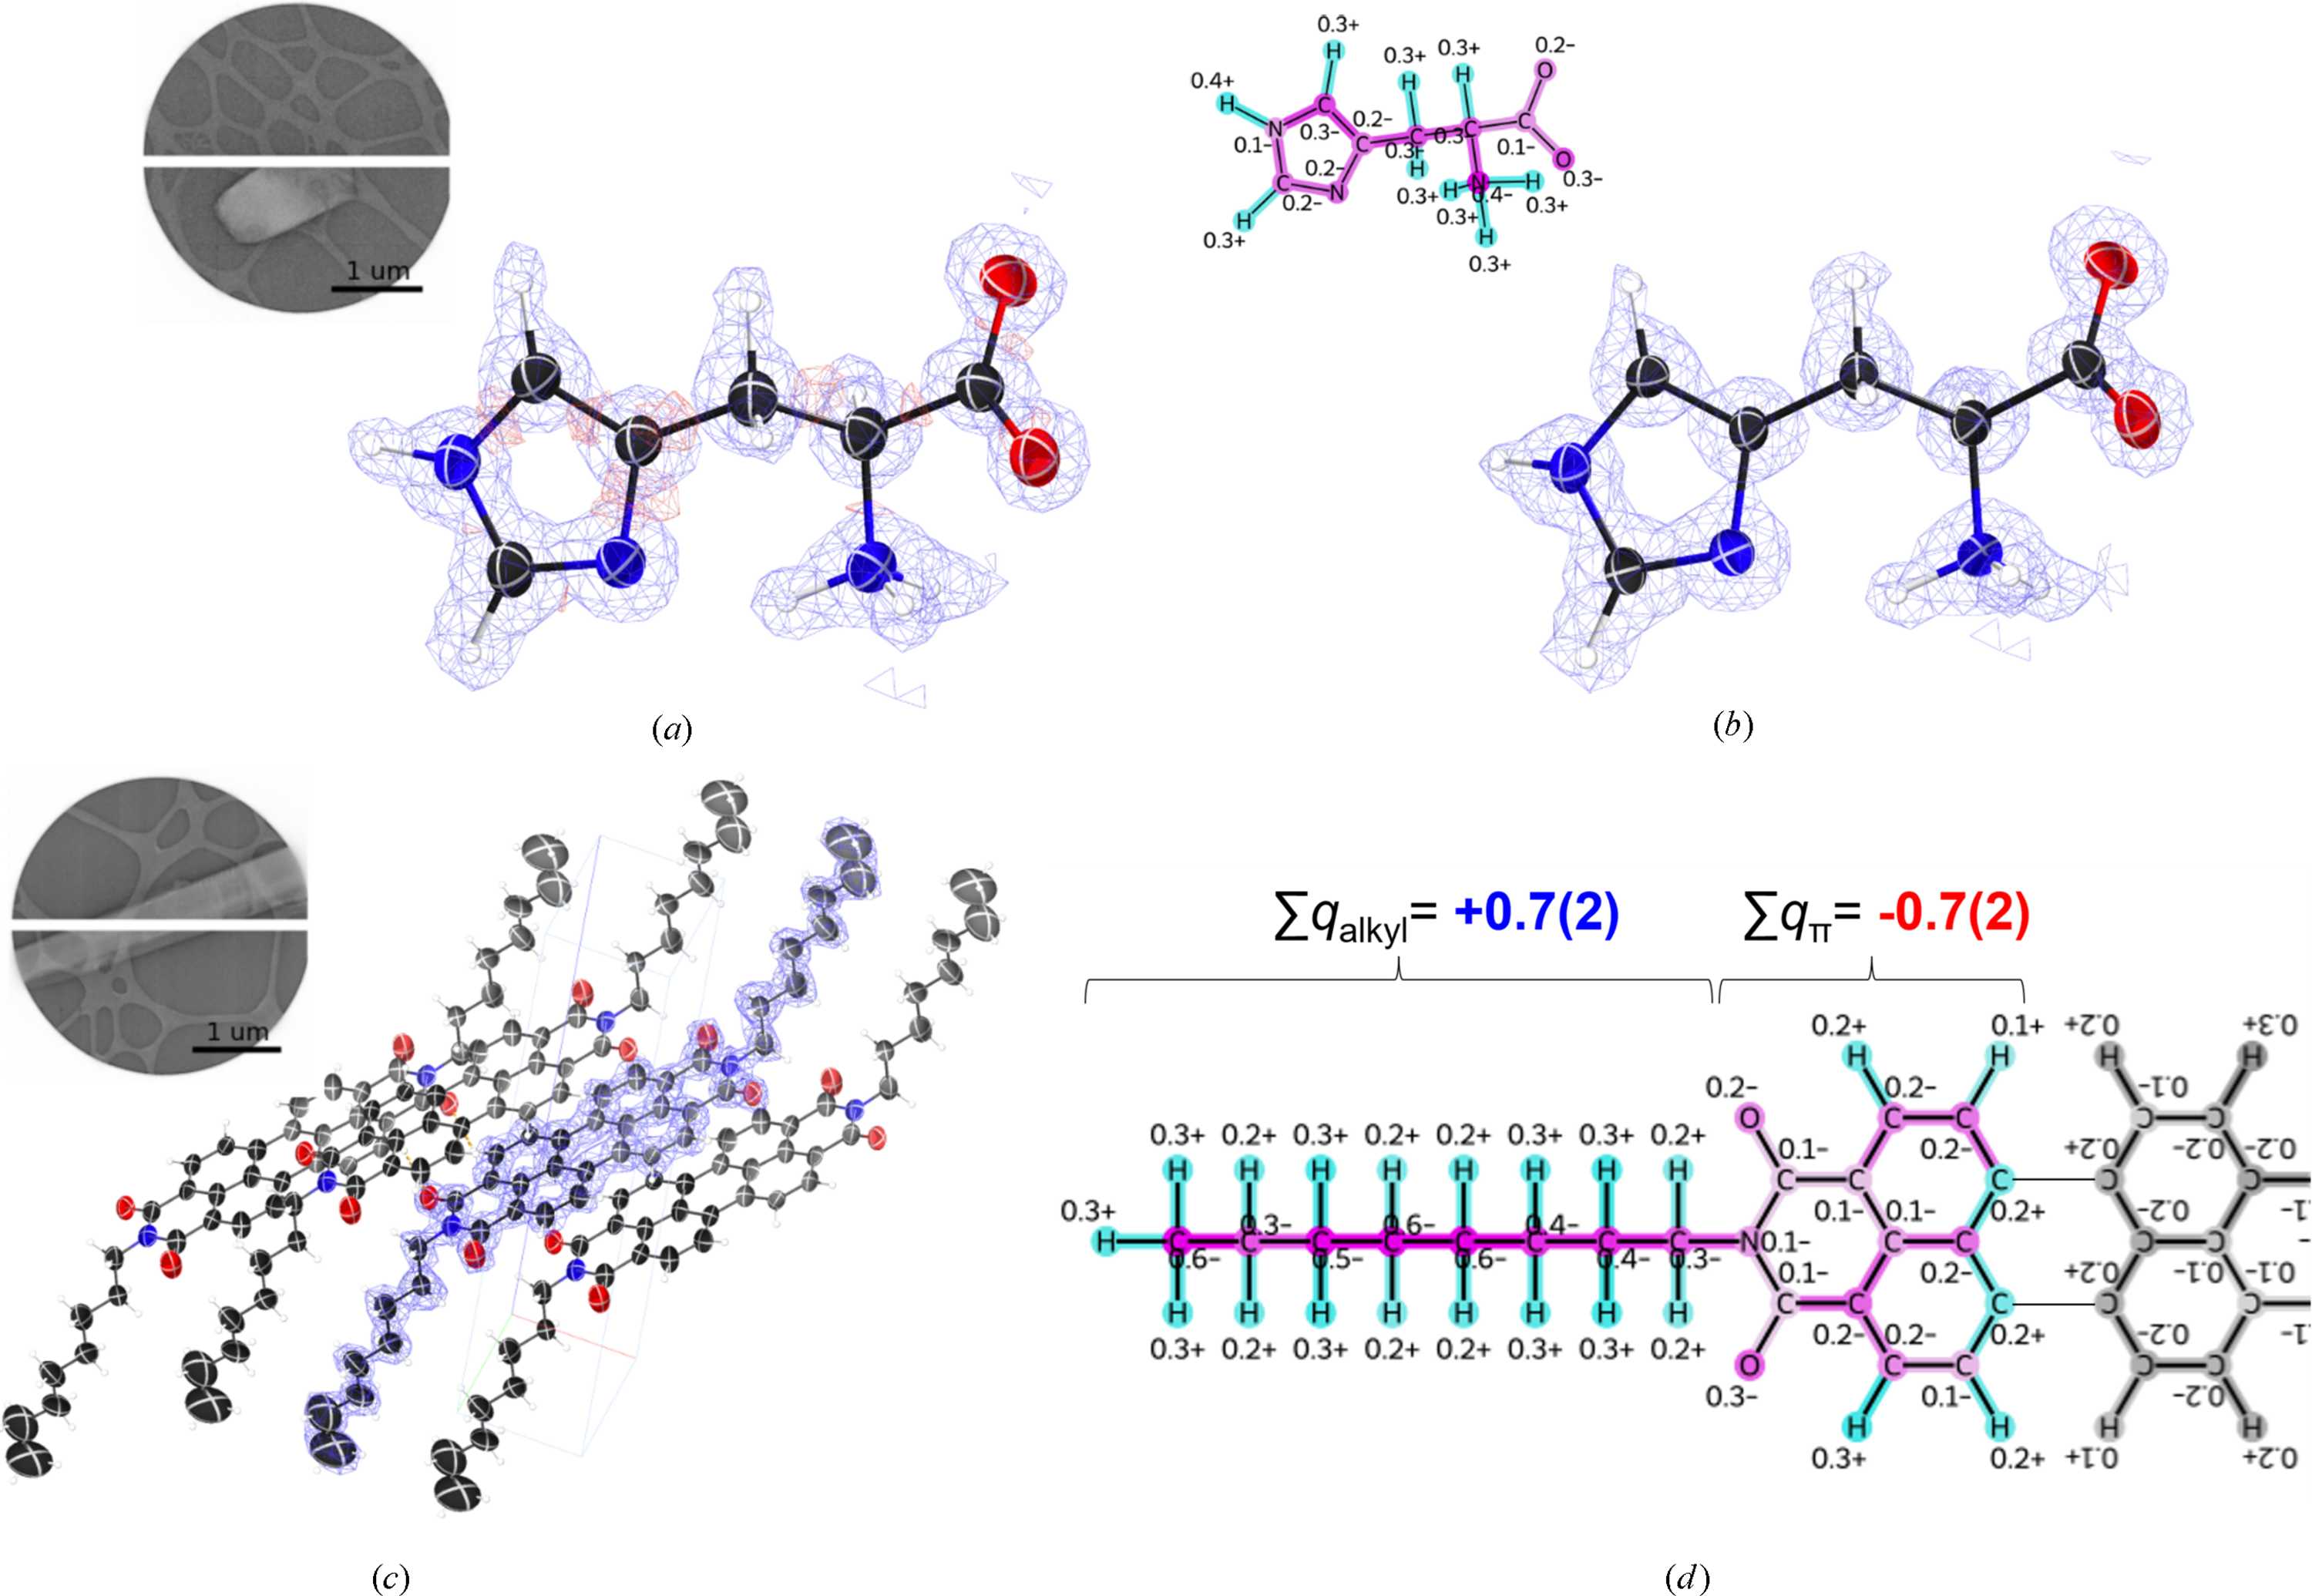
Figure 5
Structures resolved by the 3D ED workflow with JUNGFRAU. (a) Structure and electrostatic potential maps of L-histidine refined using conventional neutral-atom modeling. (b) Structure and maps after applying the iSFAC charged-atom model. The  maps are shown in blue (0.32 e− Å−1), and the  maps (−0.17 e− Å−1) are shown in red. In both cases, no continuous positive residual volume remains; in (b), negative residual volume is also absent. The inset in (b) shows the determined atomic charges. (c) Crystal structure of PTCDI-C8. The map (0.12 e− Å−1) is overlaid on the model at the center. (d) Determined atomic charges for PTCDI-C8. Half of the molecule is modeled on the basis of inversion symmetry. Partial sums of the alkyl and π-conjugated regions are indicated. The estimated standard deviations are displayed in parentheses. Insets in (a) and (c) show typical crystal images. 3D and 2D molecular pictures in (a–c) and (b, d) were created using ShelXle (Hübschle et al., 2011  ) and RDkit (Landrum, 2016), respectively. |
 | JOURNAL OF APPLIED CRYSTALLOGRAPHY |
ISSN: 1600-5767
 access