

 menu
|
|
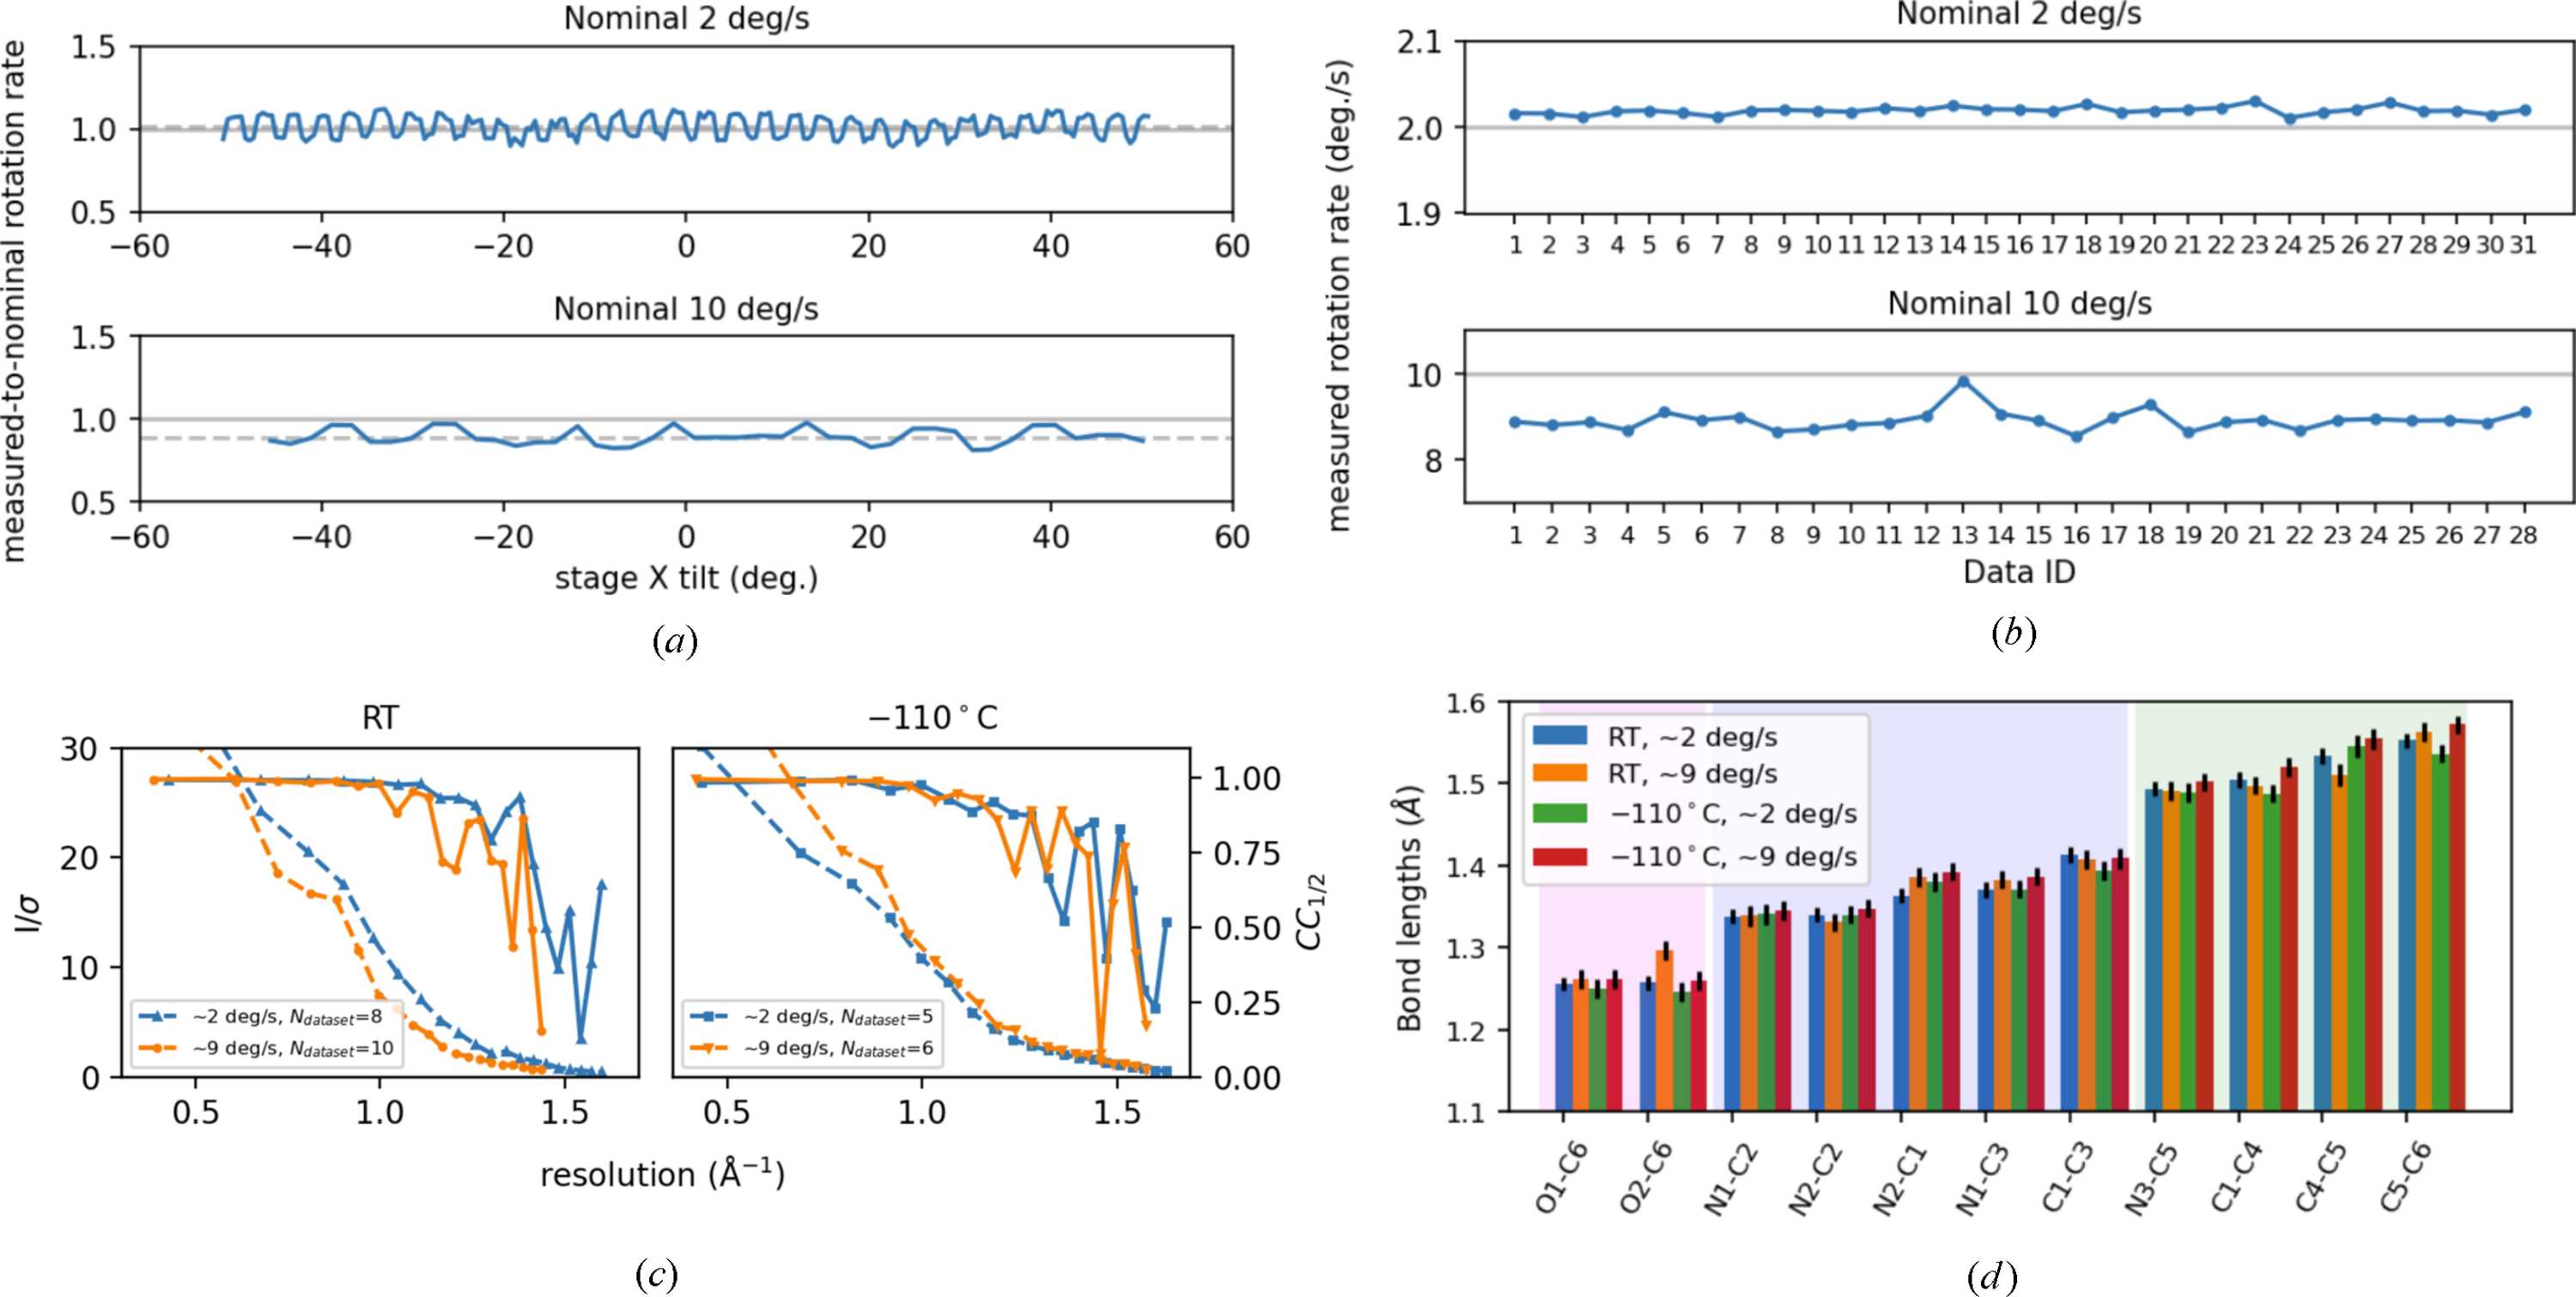
Figure 6
Verification of high-speed continuous-rotation data collection. (a) Ratios of readout to nominal tilt angles during single rotation at nominal speeds of 2° s−1 (top) and 10° s−1 (bottom). The solid gray line represents the nominal value and the dashed line represents the mean value over the rotation. (b) Mean readout value for multiple independent rotations at 2° s−1 (top) and at 10° s−1 (bottom). The solid gray line represents the nominal value. (c) Statistics per resolution shell for L-histidine data collected at RT (left) and cryogenic (−110°C, right) conditions. The solid lines are CC1/2 on the right axes, and the dashed lines are for  on the left axes. (d) The determined bond lengths of L-histidine. The error bars indicate the estimated standard deviations. Background shading indicates bond types (carboxylic, aromatic and single). |
 | JOURNAL OF APPLIED CRYSTALLOGRAPHY |
ISSN: 1600-5767
 access