

 menu
|
|
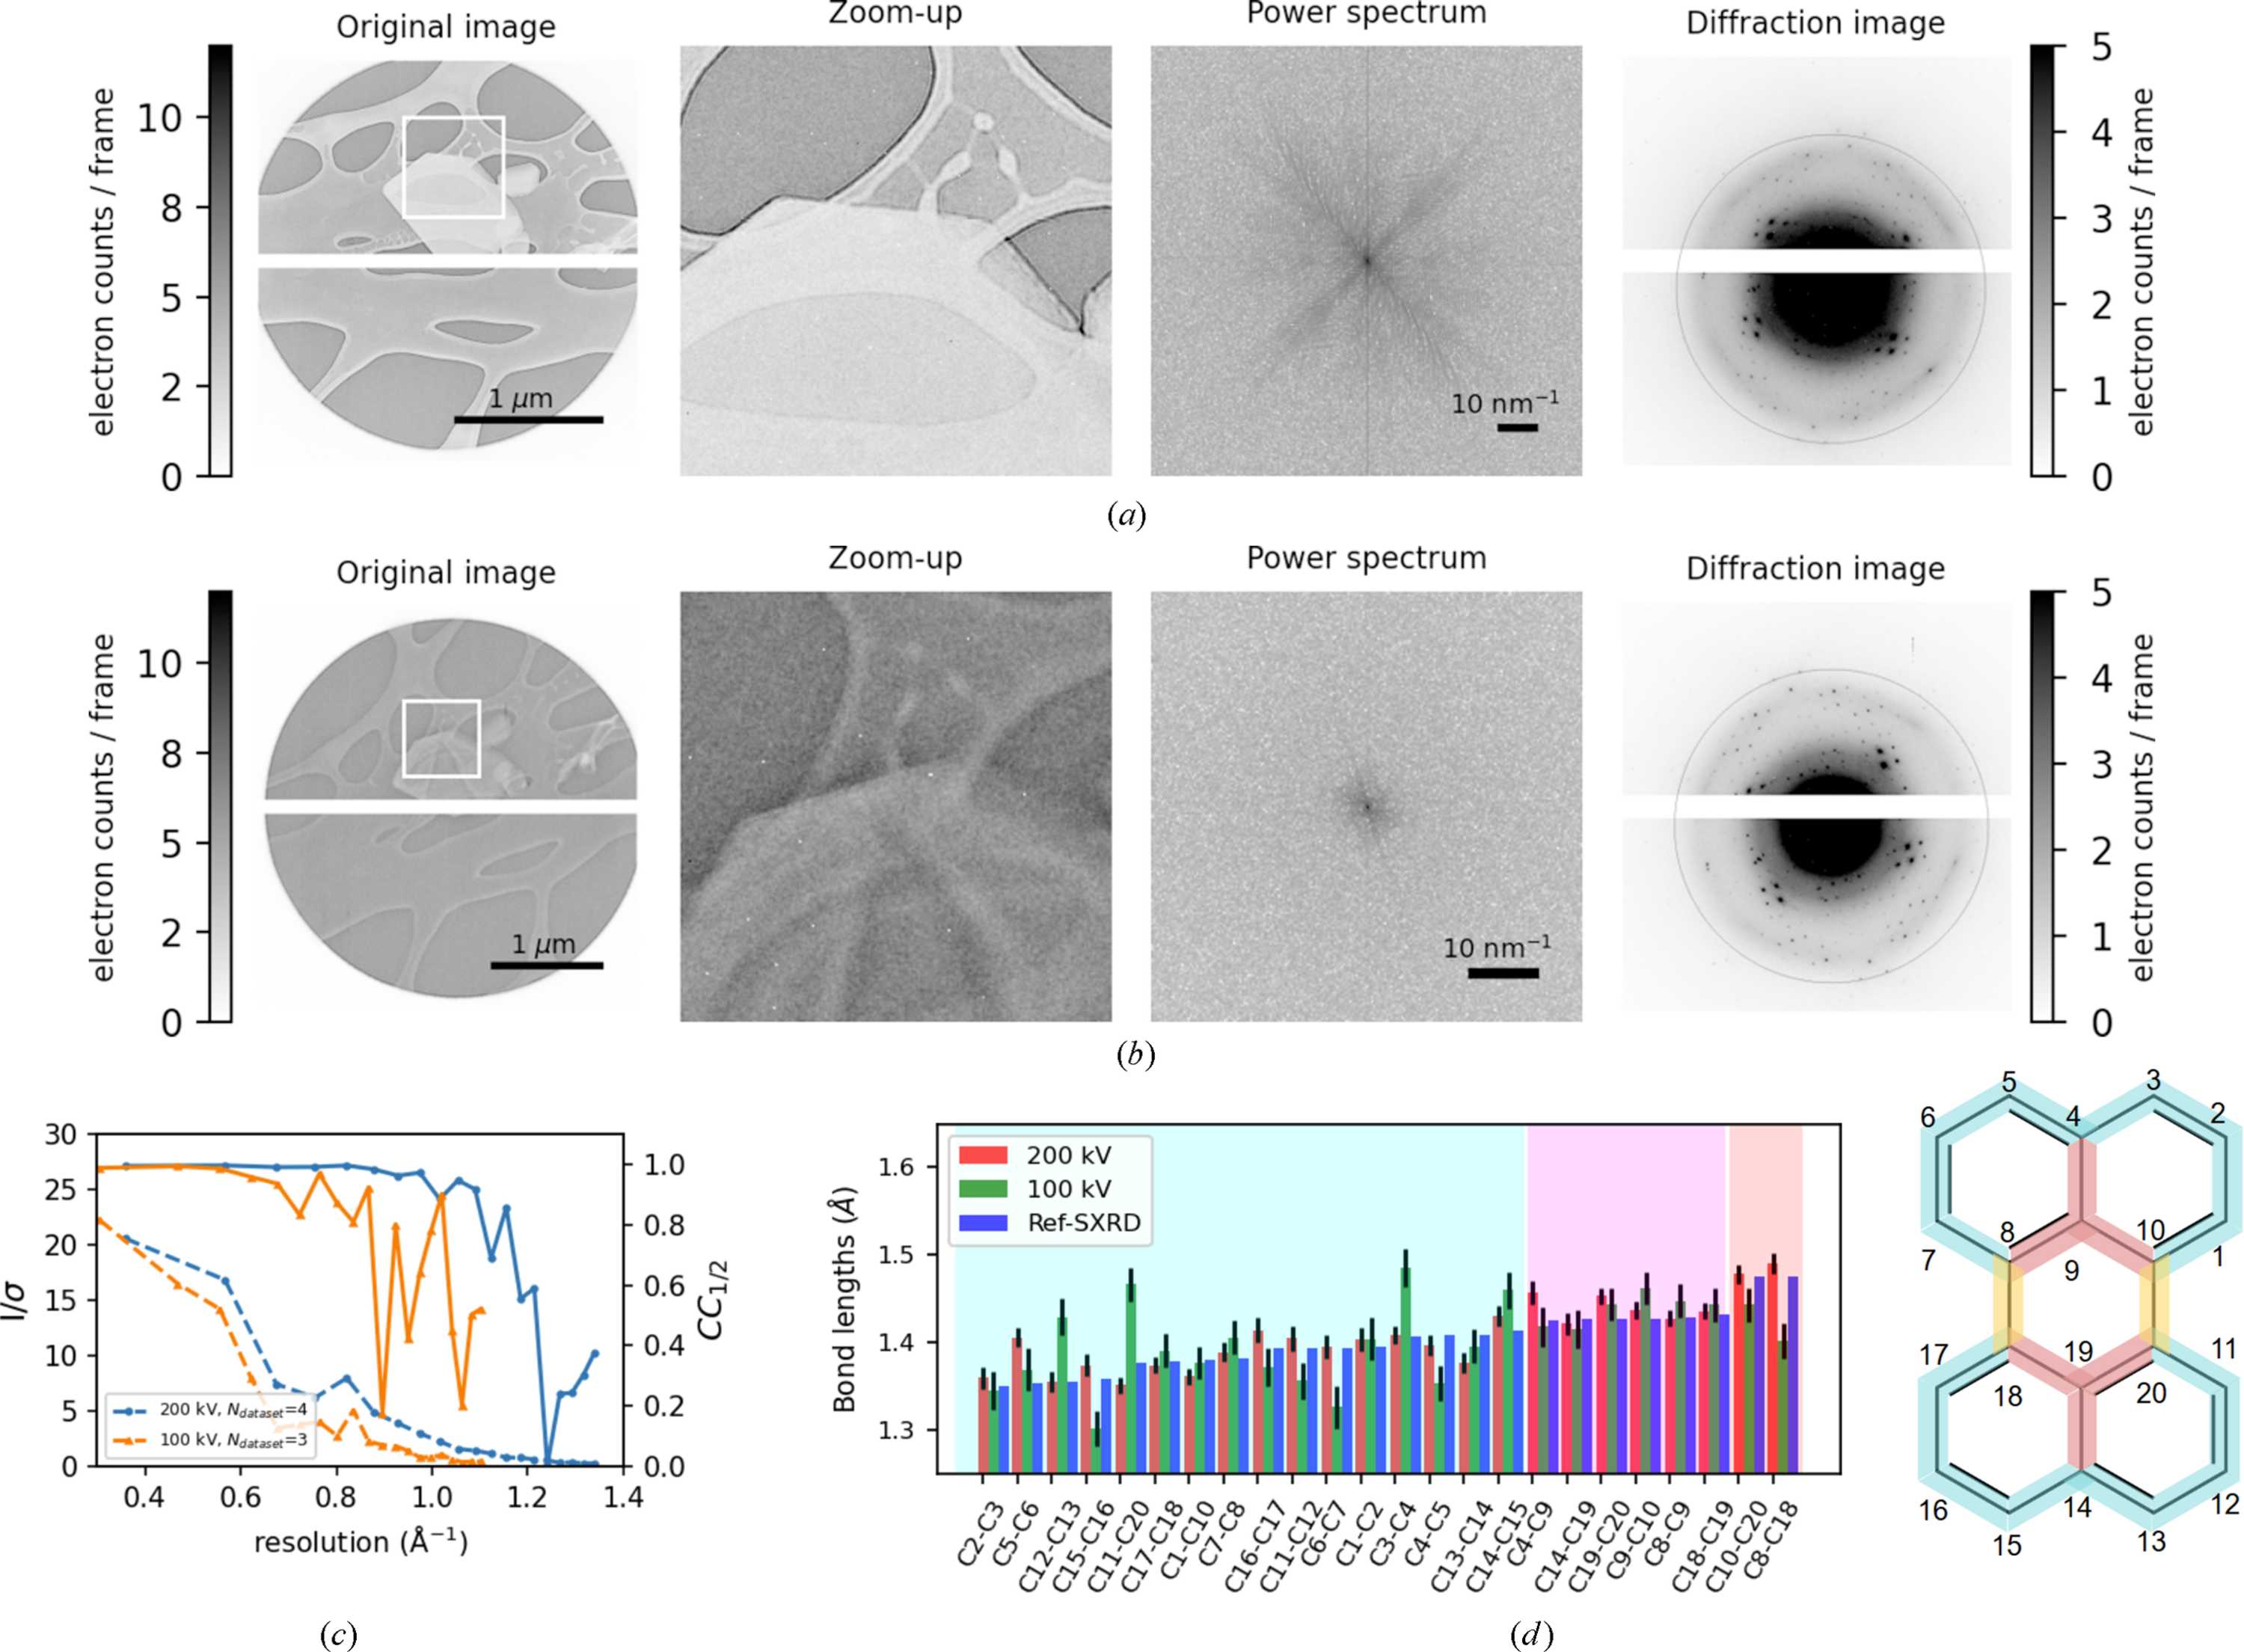
Figure 7
Real- and reciprocal-space resolution of perylene crystals measured with 100 and 200 kV electron beams. (a, b) Real-space (left) and diffraction (right) images of the same crystal acquired at 100 kV (a) and 200 kV (b). The two middle panels show a magnified view of a selected region in the real-space image and its corresponding power spectrum. The contrast scales are indicated by the bars on each side. The gray ring in the diffraction image indicates a resolution of 1 Å. (c) Dataset statistics per resolution shell. The solid lines are for CC1/2 on the right axes, and the dashed lines are for  on the left axes. (d) The determined bond lengths. The error bars indicate the estimated standard deviation. For reference, the SXRD structure measured under room temperature from CCDC depositions is shown (Näther et al., 1998  ). Atomic labels correspond to the chemical formula in the right panel, and bonds are colored according to their environment. |
 | JOURNAL OF APPLIED CRYSTALLOGRAPHY |
ISSN: 1600-5767
 access