

 menu
|
|
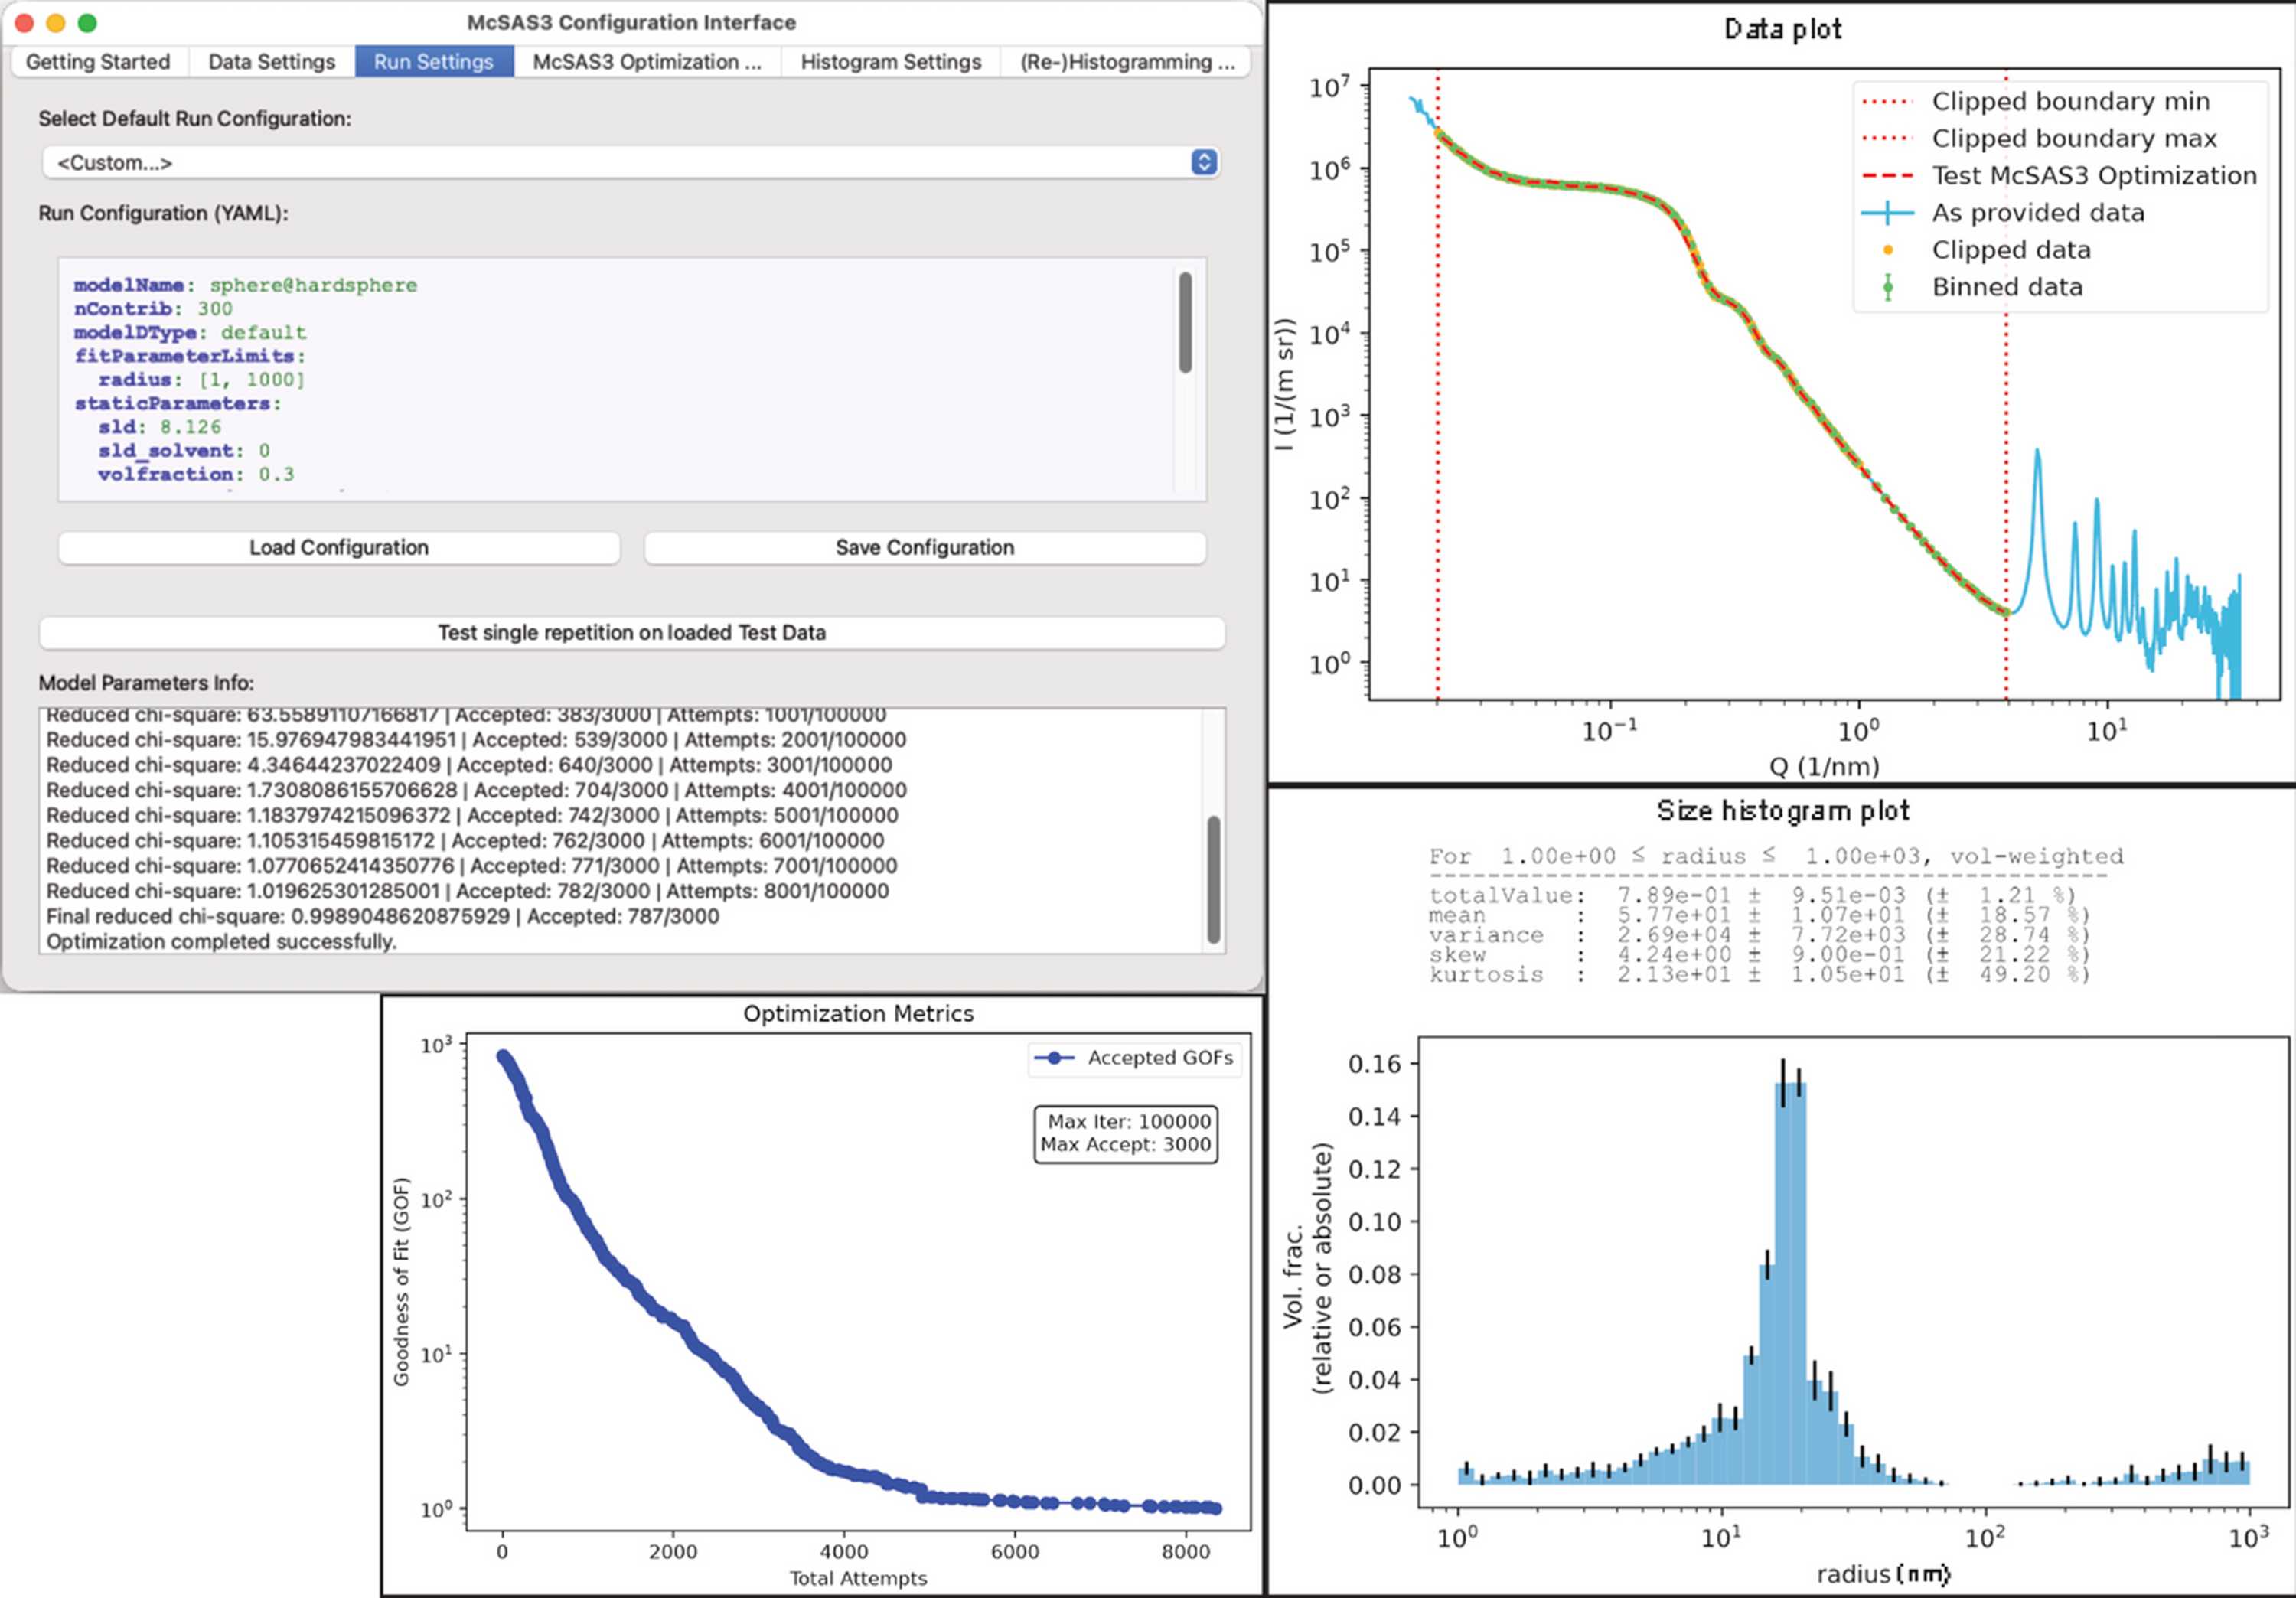
Figure 2
The panels of the McSAS3GUI user interface showing an optimization on a ZIF-8 dataset, with the main GUI shown in the top left, the loaded, clipped, rebinned data and fit shown in the top right, the output PDF in the bottom left with the data and size distribution, and the evolution of the optimization parameter in the bottom right. |
 | JOURNAL OF APPLIED CRYSTALLOGRAPHY |
ISSN: 1600-5767
 access