

 menu
|
|
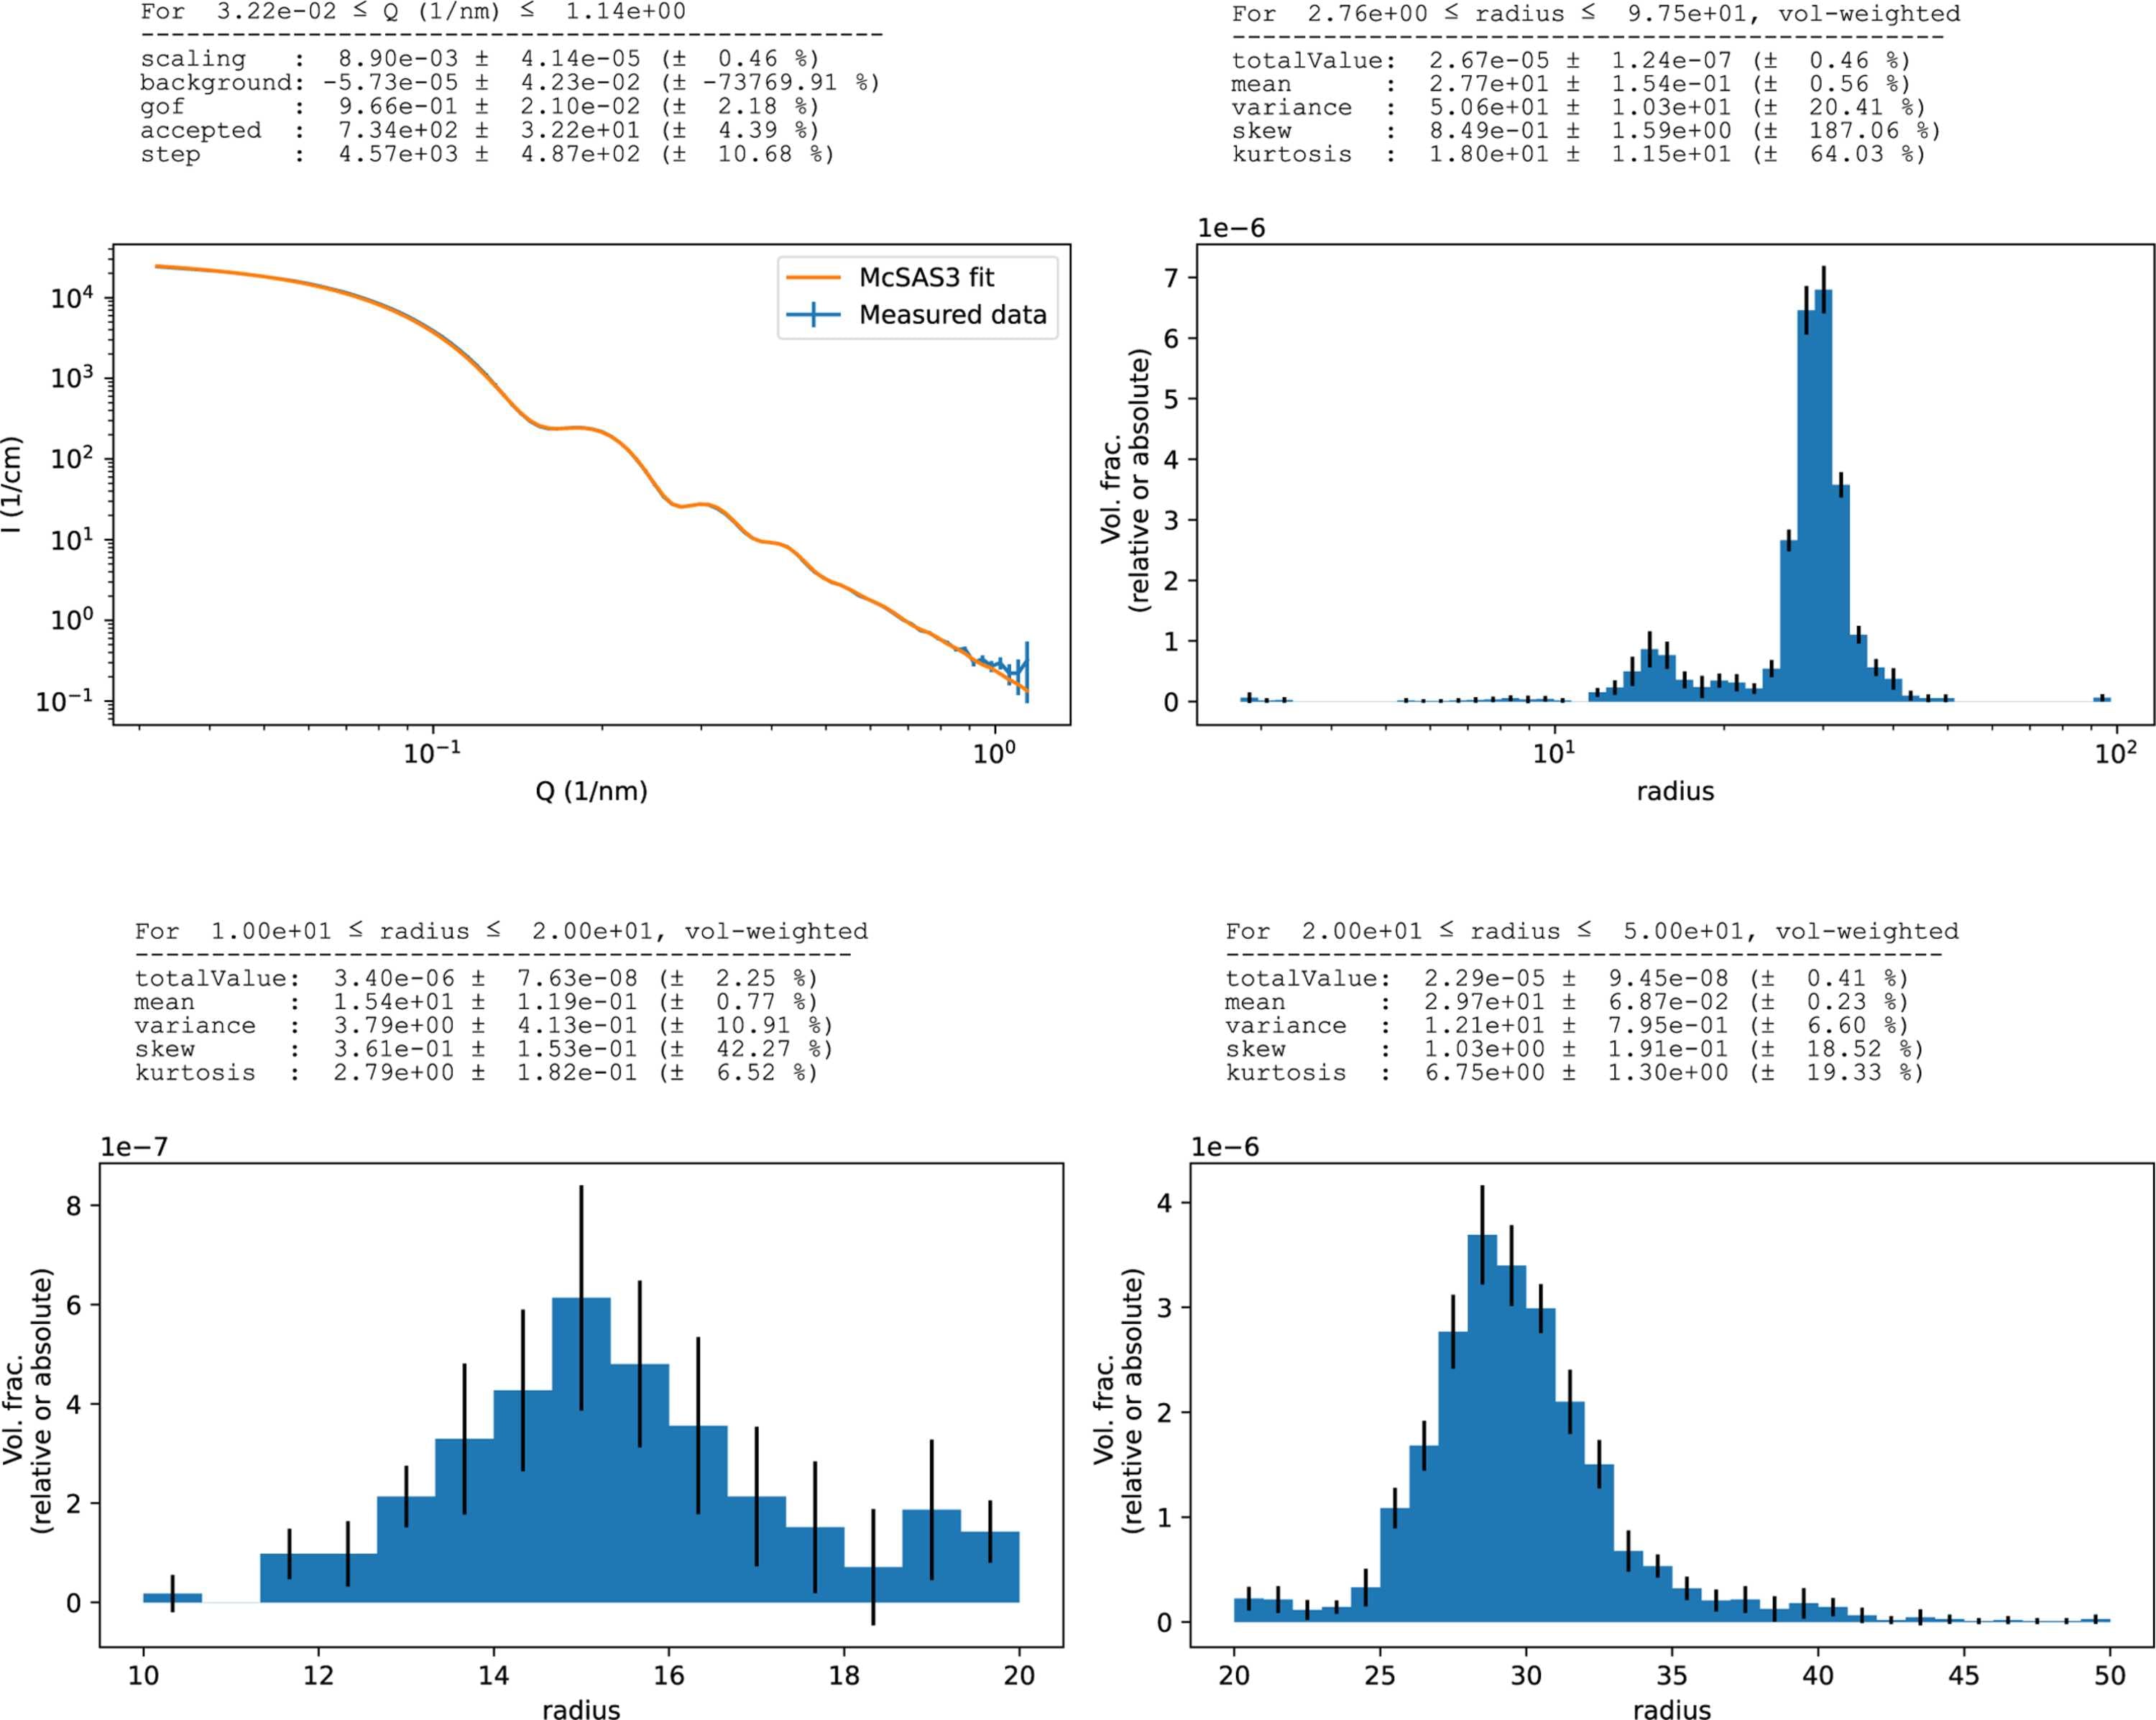
Figure 3
The analysis result of scattering from a bimodal gold nanoparticle suspension. Top left: data and fit. Top right: overall size histogram. Bottom left: first population. Bottom right: second population. Note that the lower graphs use linear binning edges, and therefore show a slightly different histogram than when using logarithmically spaced histogram bin edges (as used in the top-right figure). |
 | JOURNAL OF APPLIED CRYSTALLOGRAPHY |
ISSN: 1600-5767
 access