

 menu
|
|
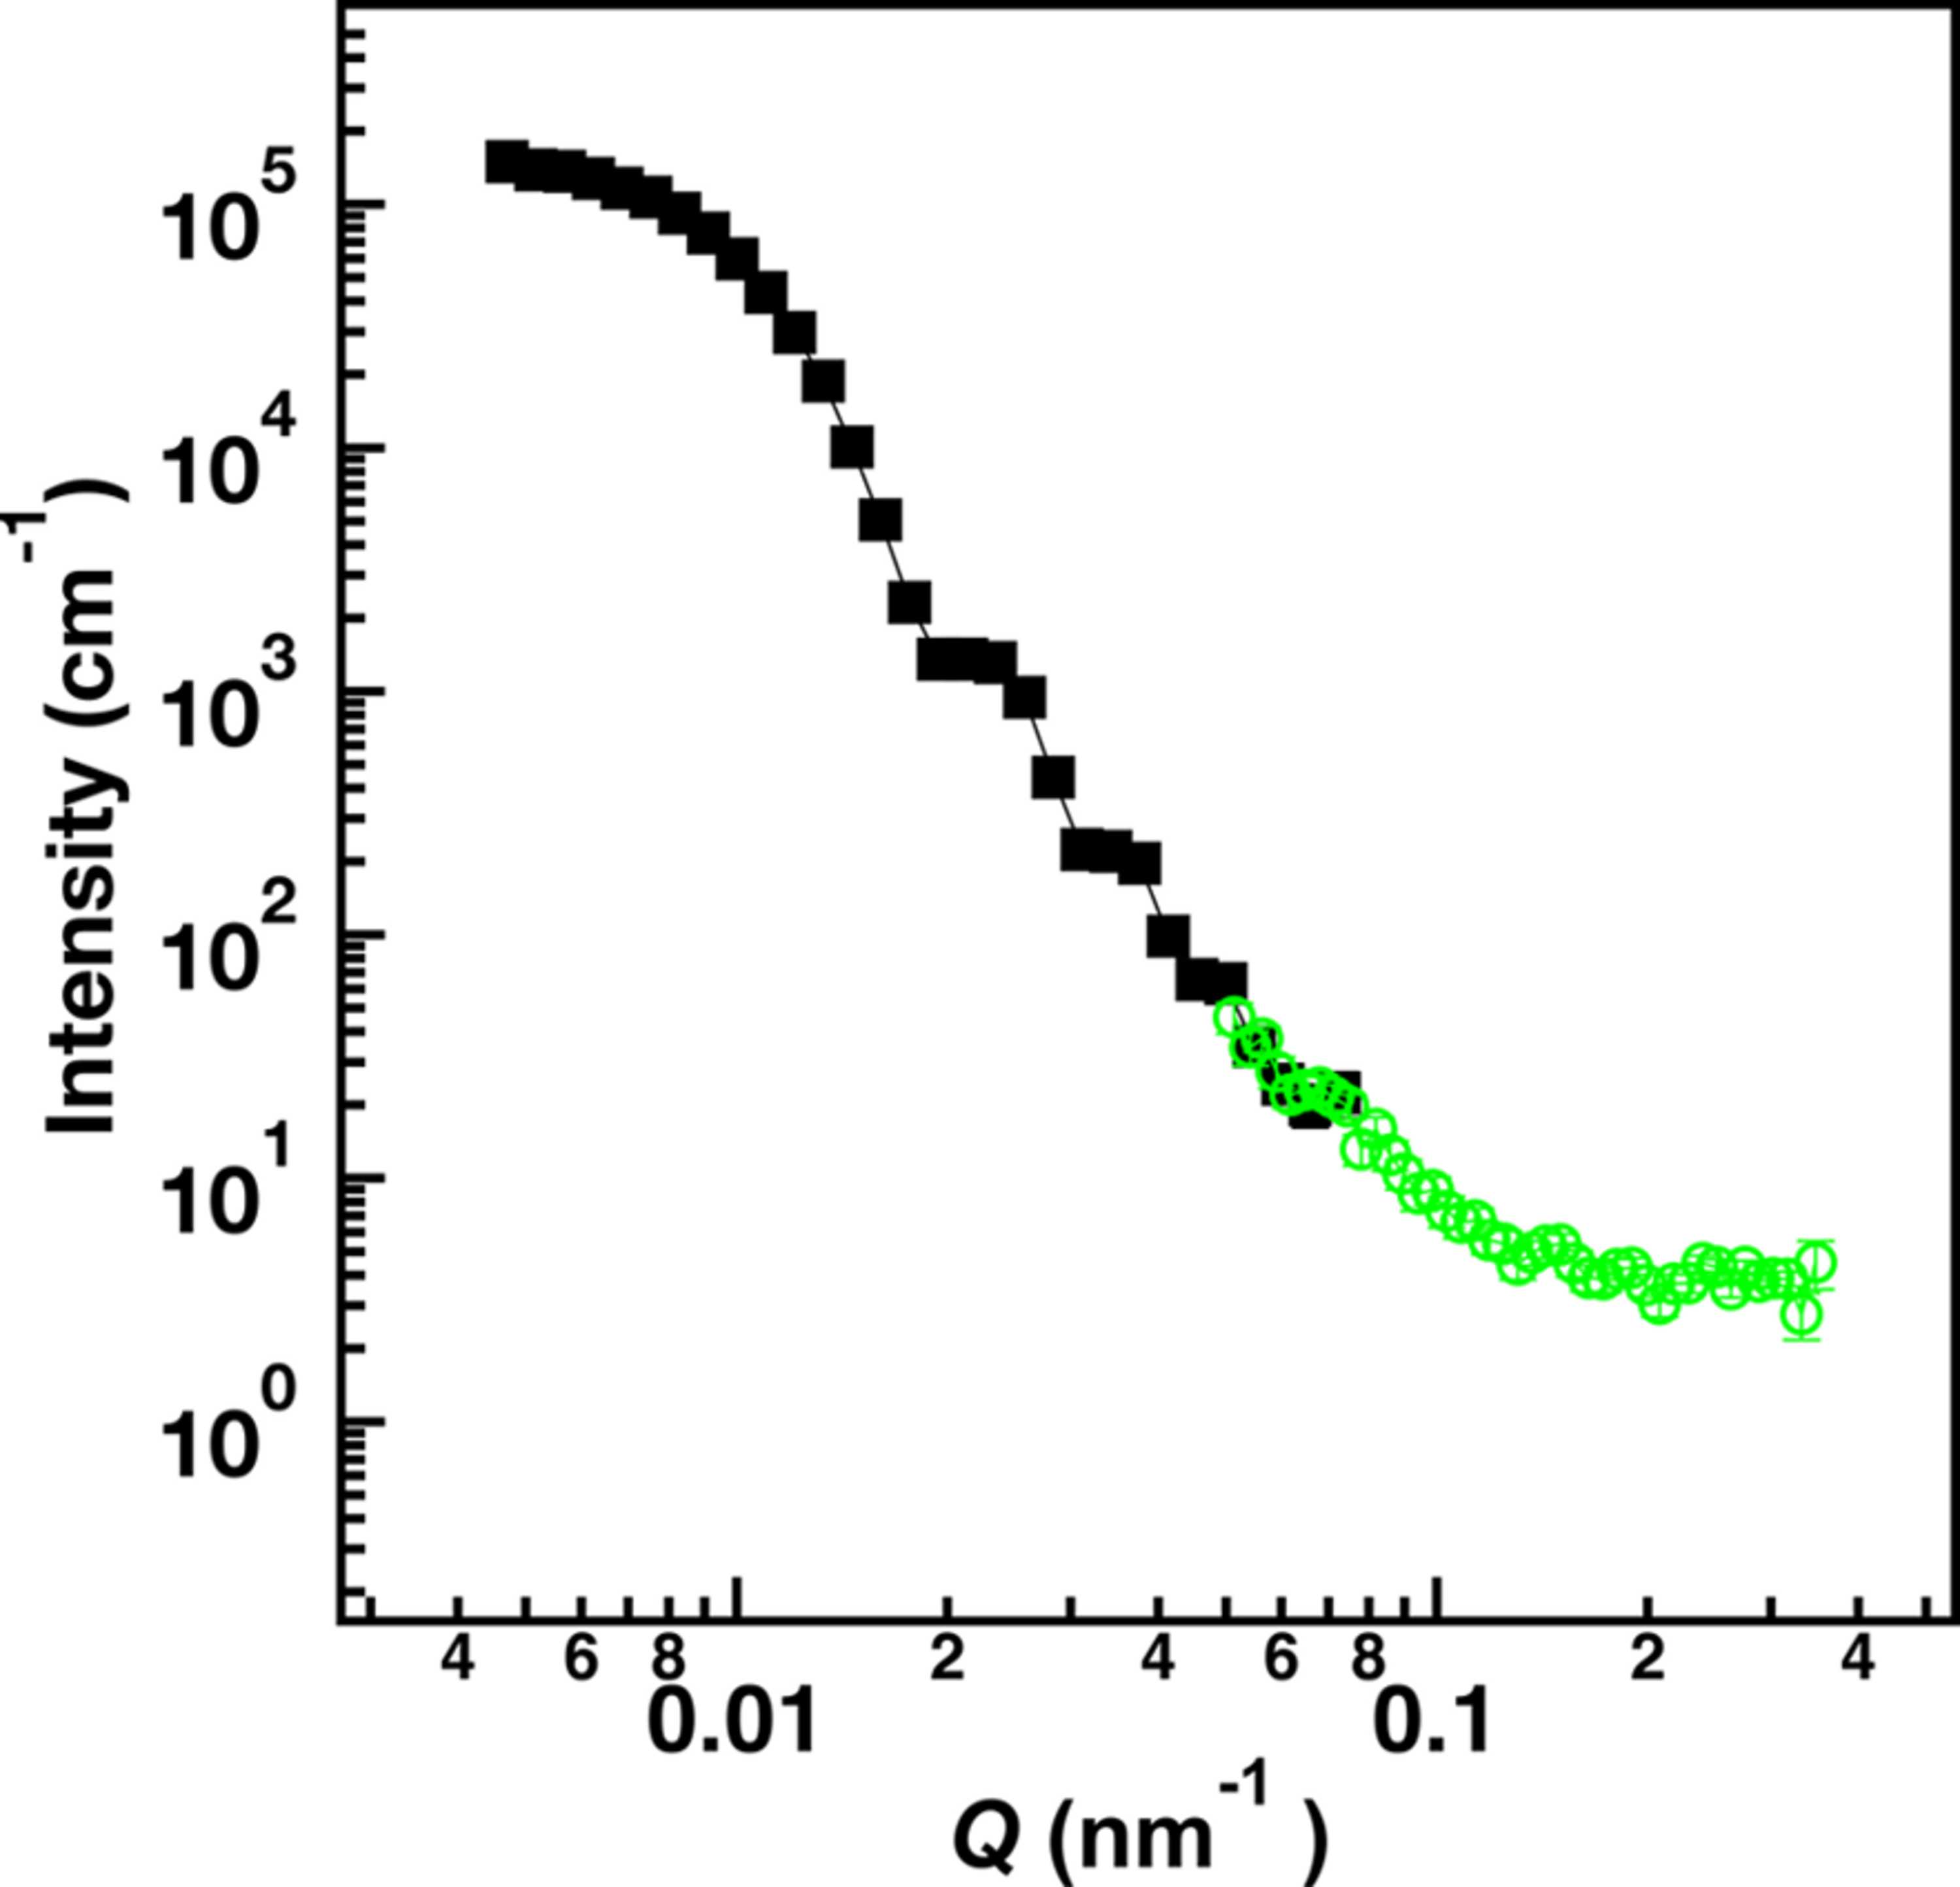
Figure 10
Intensity versus Q plots of the 508 nm-diameter polystyrene nanoparticles measured simultaneously with the FPD (filled squares) and the 3He main detector (open circles) in the focusing configuration shown in Fig. 1  (c) using an upstream slit aperture (Au) of 5 mm for 21600 s. The intensities obtained with both detectors were calibrated on an absolute scale using the calculated scattering intensity of the polystyrene nanoparticles. |
 | JOURNAL OF APPLIED CRYSTALLOGRAPHY |
ISSN: 1600-5767
 access