

 menu
|
|
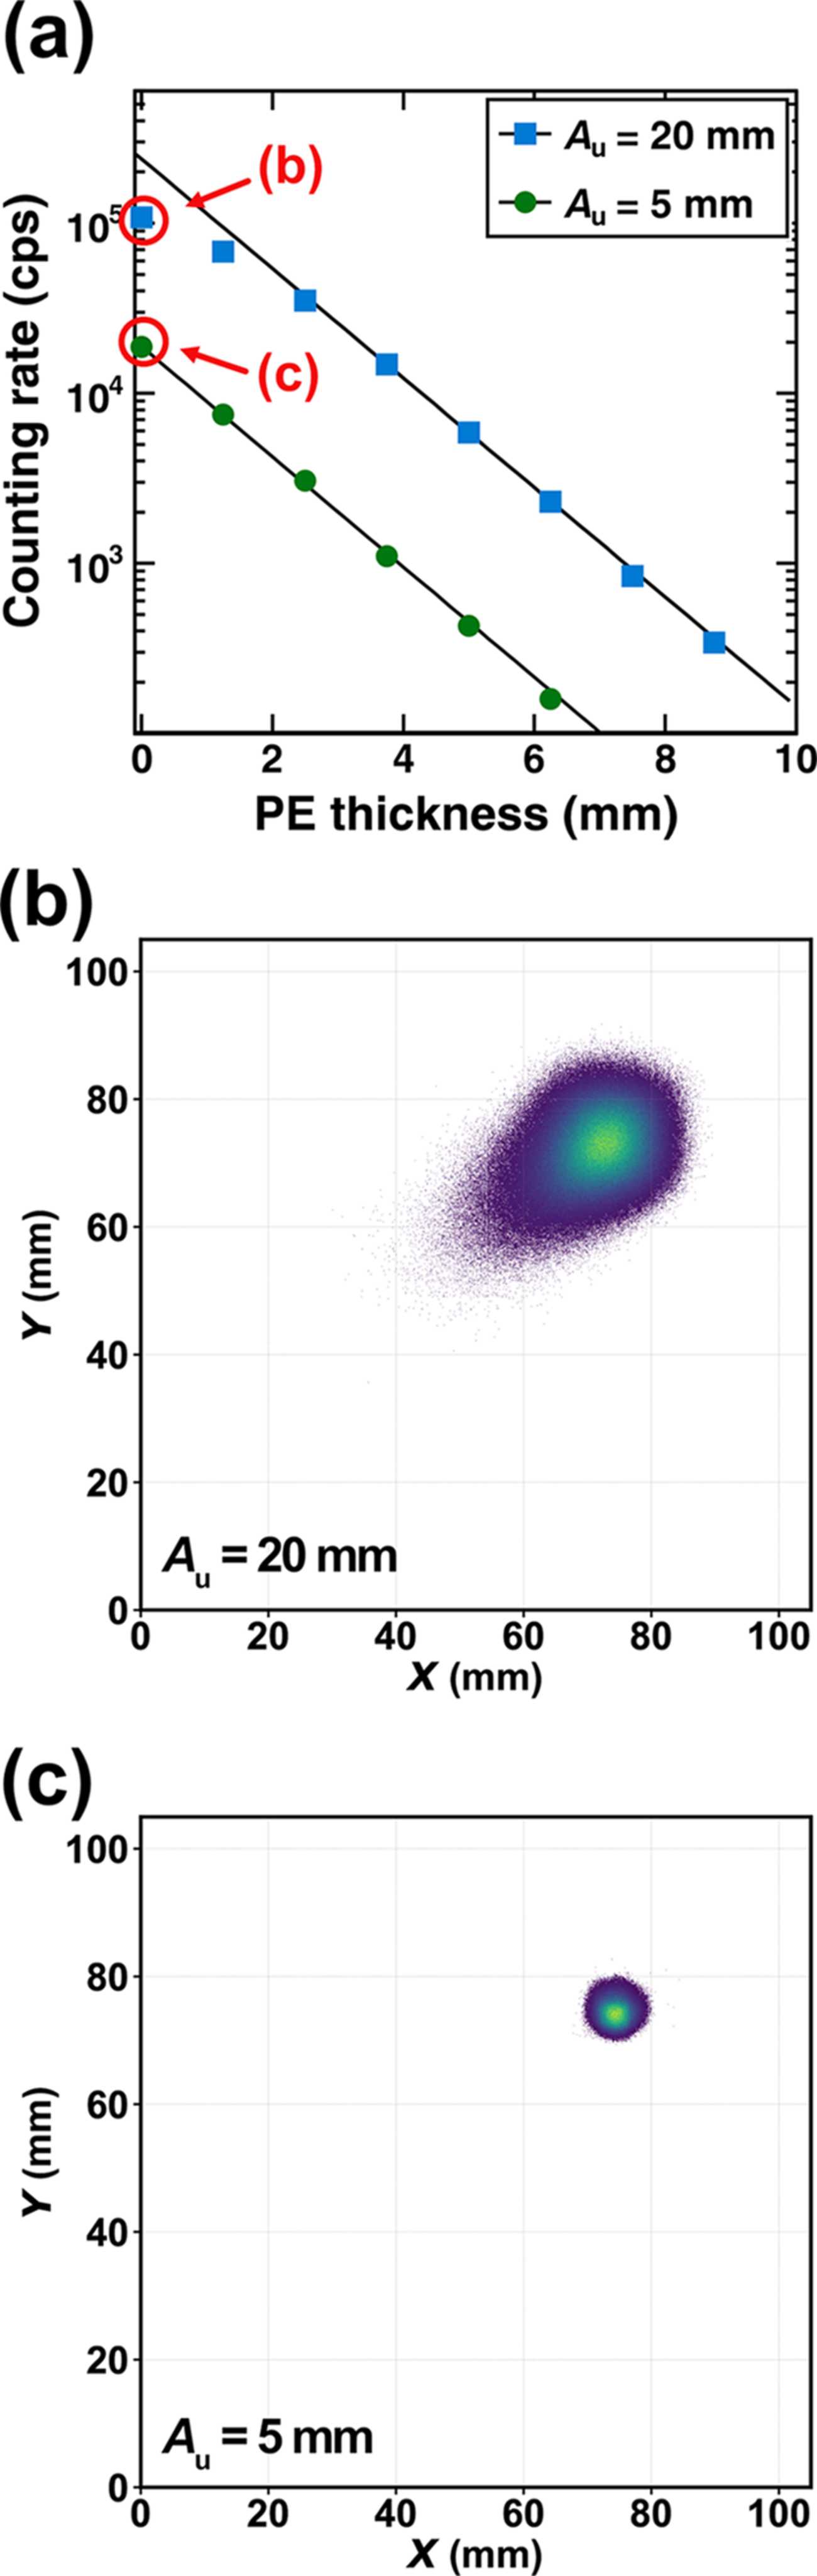
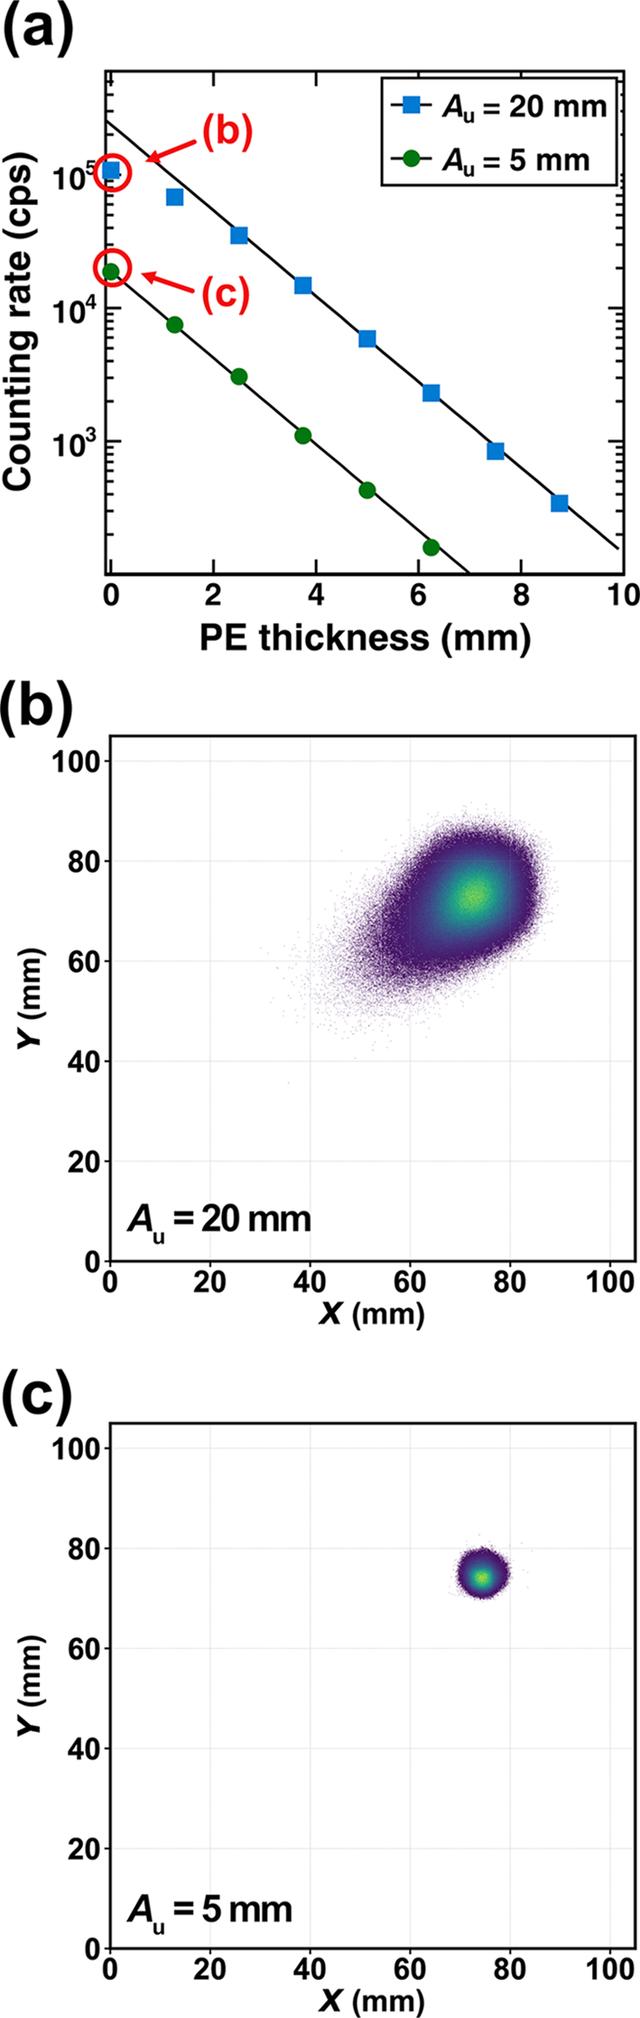
Figure 7
(a) Count rate over the entire detector as a function of the PE thickness for the tight focusing neutron beam. Each data point was acquired for 20 s. (b, c) FPD images of the unattenuated neutron beam (zero PE thickness). |
 | JOURNAL OF APPLIED CRYSTALLOGRAPHY |
ISSN: 1600-5767
 access