

 menu
|
|
Figure 9
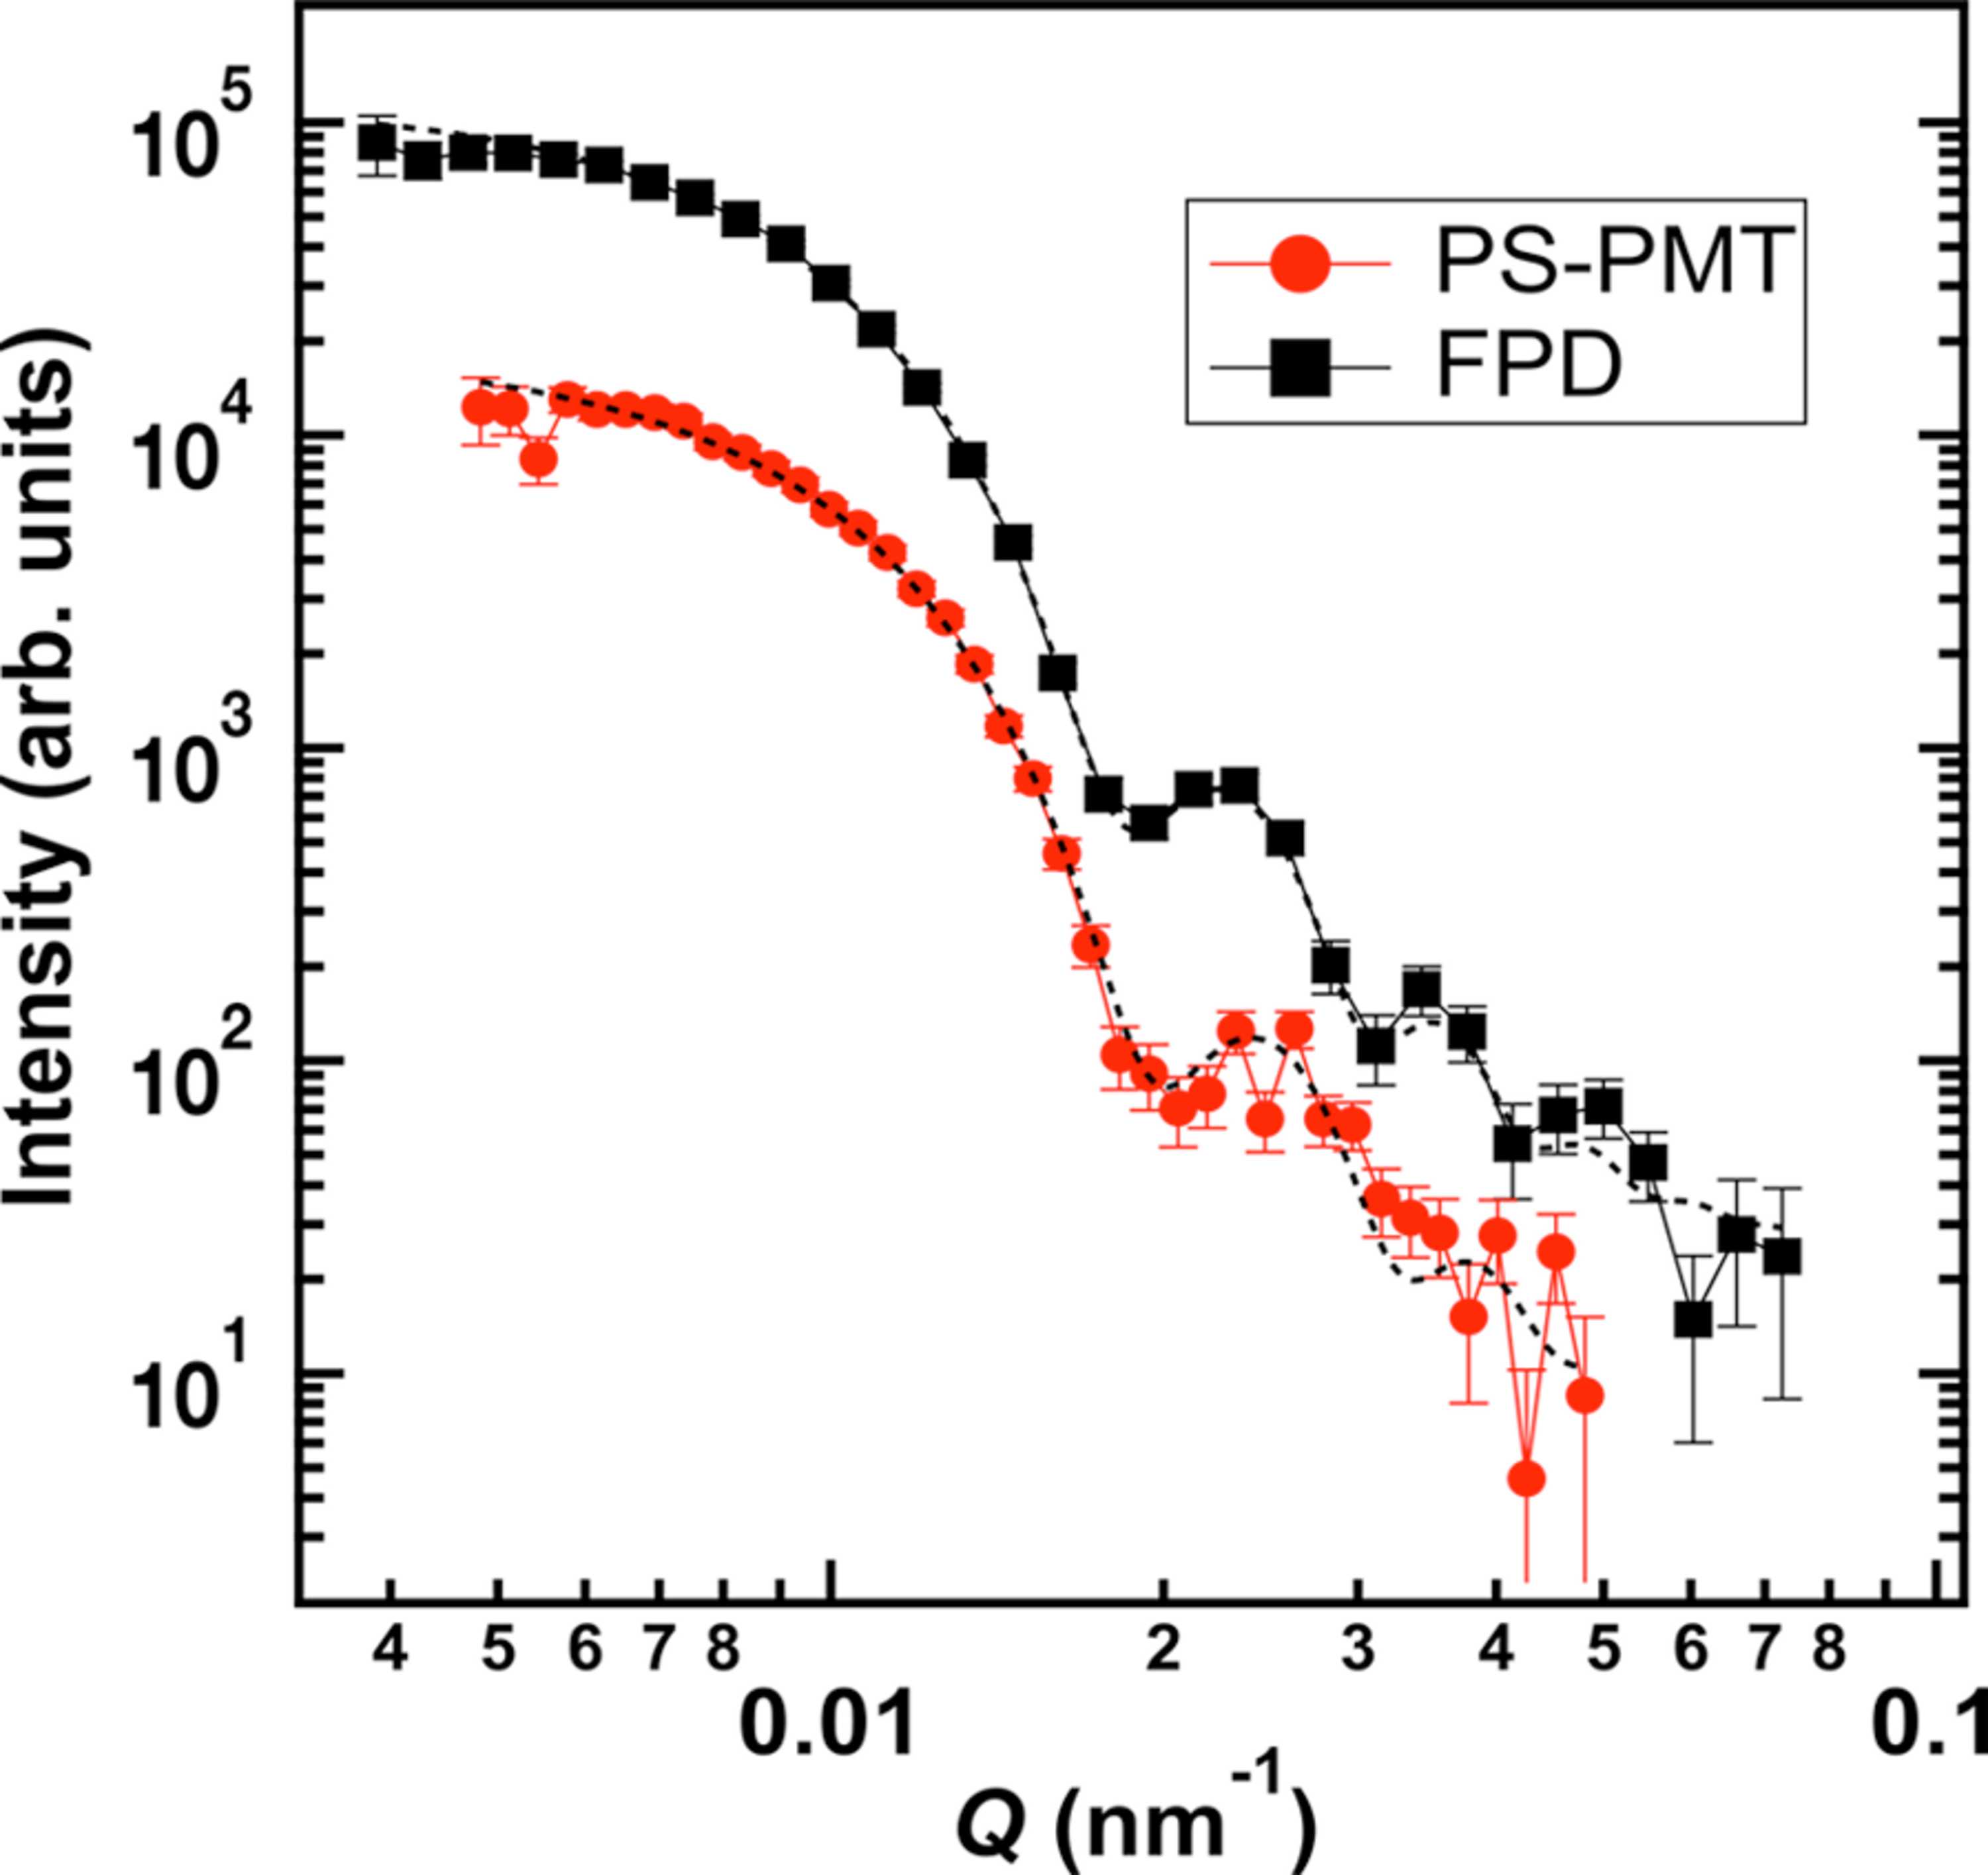
Intensity versus Q plot of 508 nm-diameter polystyrene nanoparticles measured with the focusing beam (Au = 2 mm) using the PS-PMT for 1800 s and the FPD for 2000 s. The intensities were scaled by the incident neutron counts to evaluate the improvement in the signal-to-noise ratio resulting from the higher counting rate of the FPD. The dashed lines represent the theoretical curves smeared by the instrumental resolution. |
 | JOURNAL OF APPLIED CRYSTALLOGRAPHY |
ISSN: 1600-5767
 access