


 menu
|
|
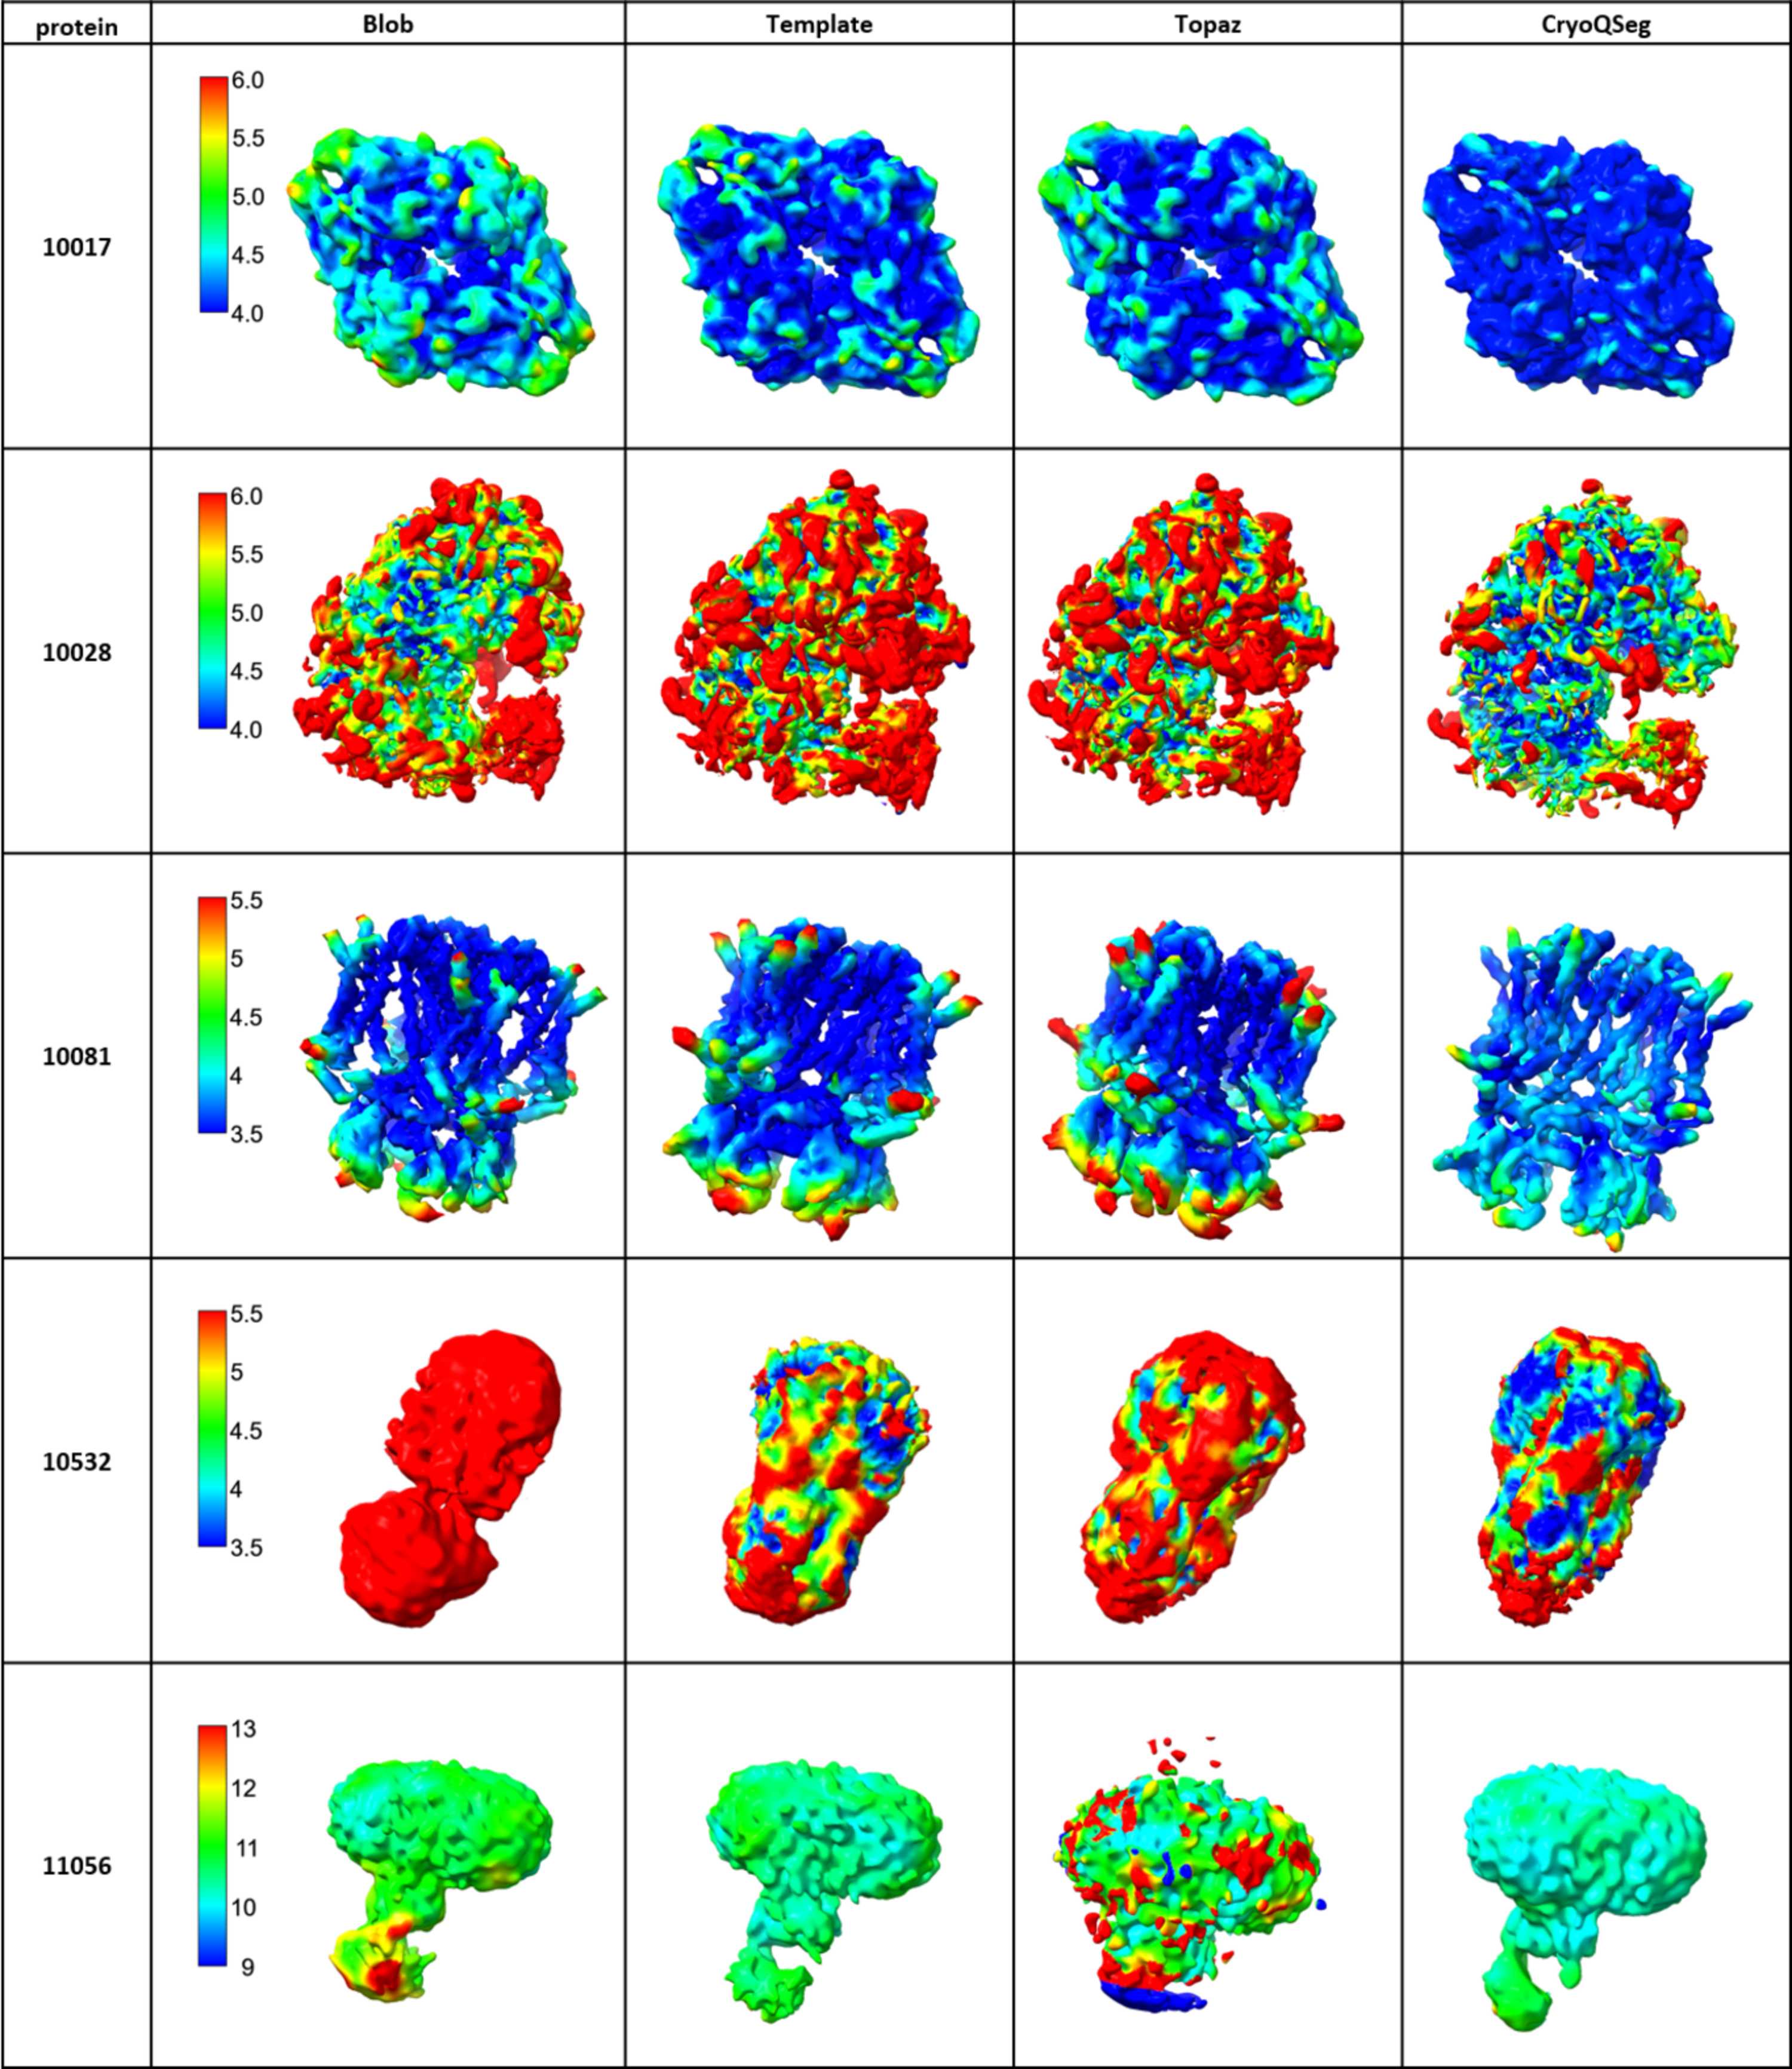
Figure 9
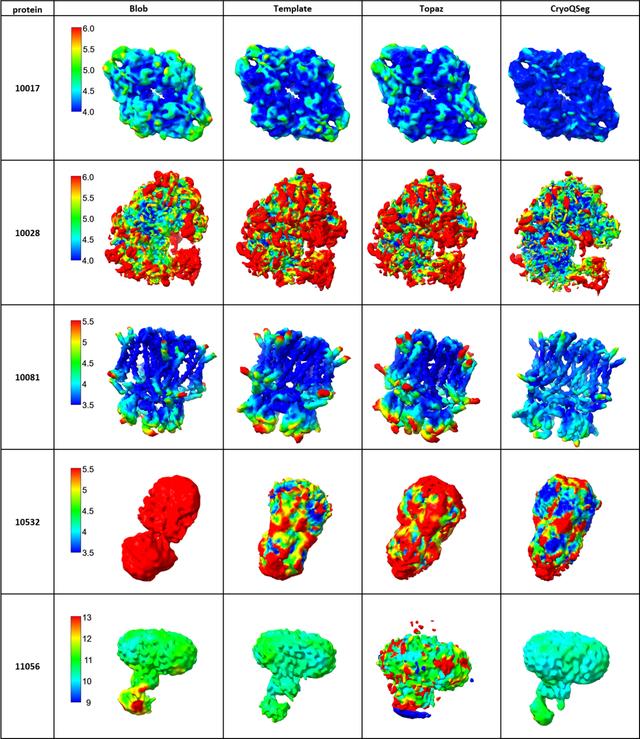
Local-resolution-colored 3D density maps for reconstructions obtained using blob detection, template matching, Topaz and CryoQSeg across five EMPIAR datasets. Each density map is colored on a per-voxel basis according to its local resolution. The color bars indicate local-resolution values in ångströms, where smaller values (blue color) represent better-resolved map regions. Note that reconstructed density maps of CryoSegNet were not publicly available and are therefore excluded in this local-resolution comparison. |
IUCrJ
ISSN: 2052-2525
CRYO | EM
Open  access