


 menu
|
|
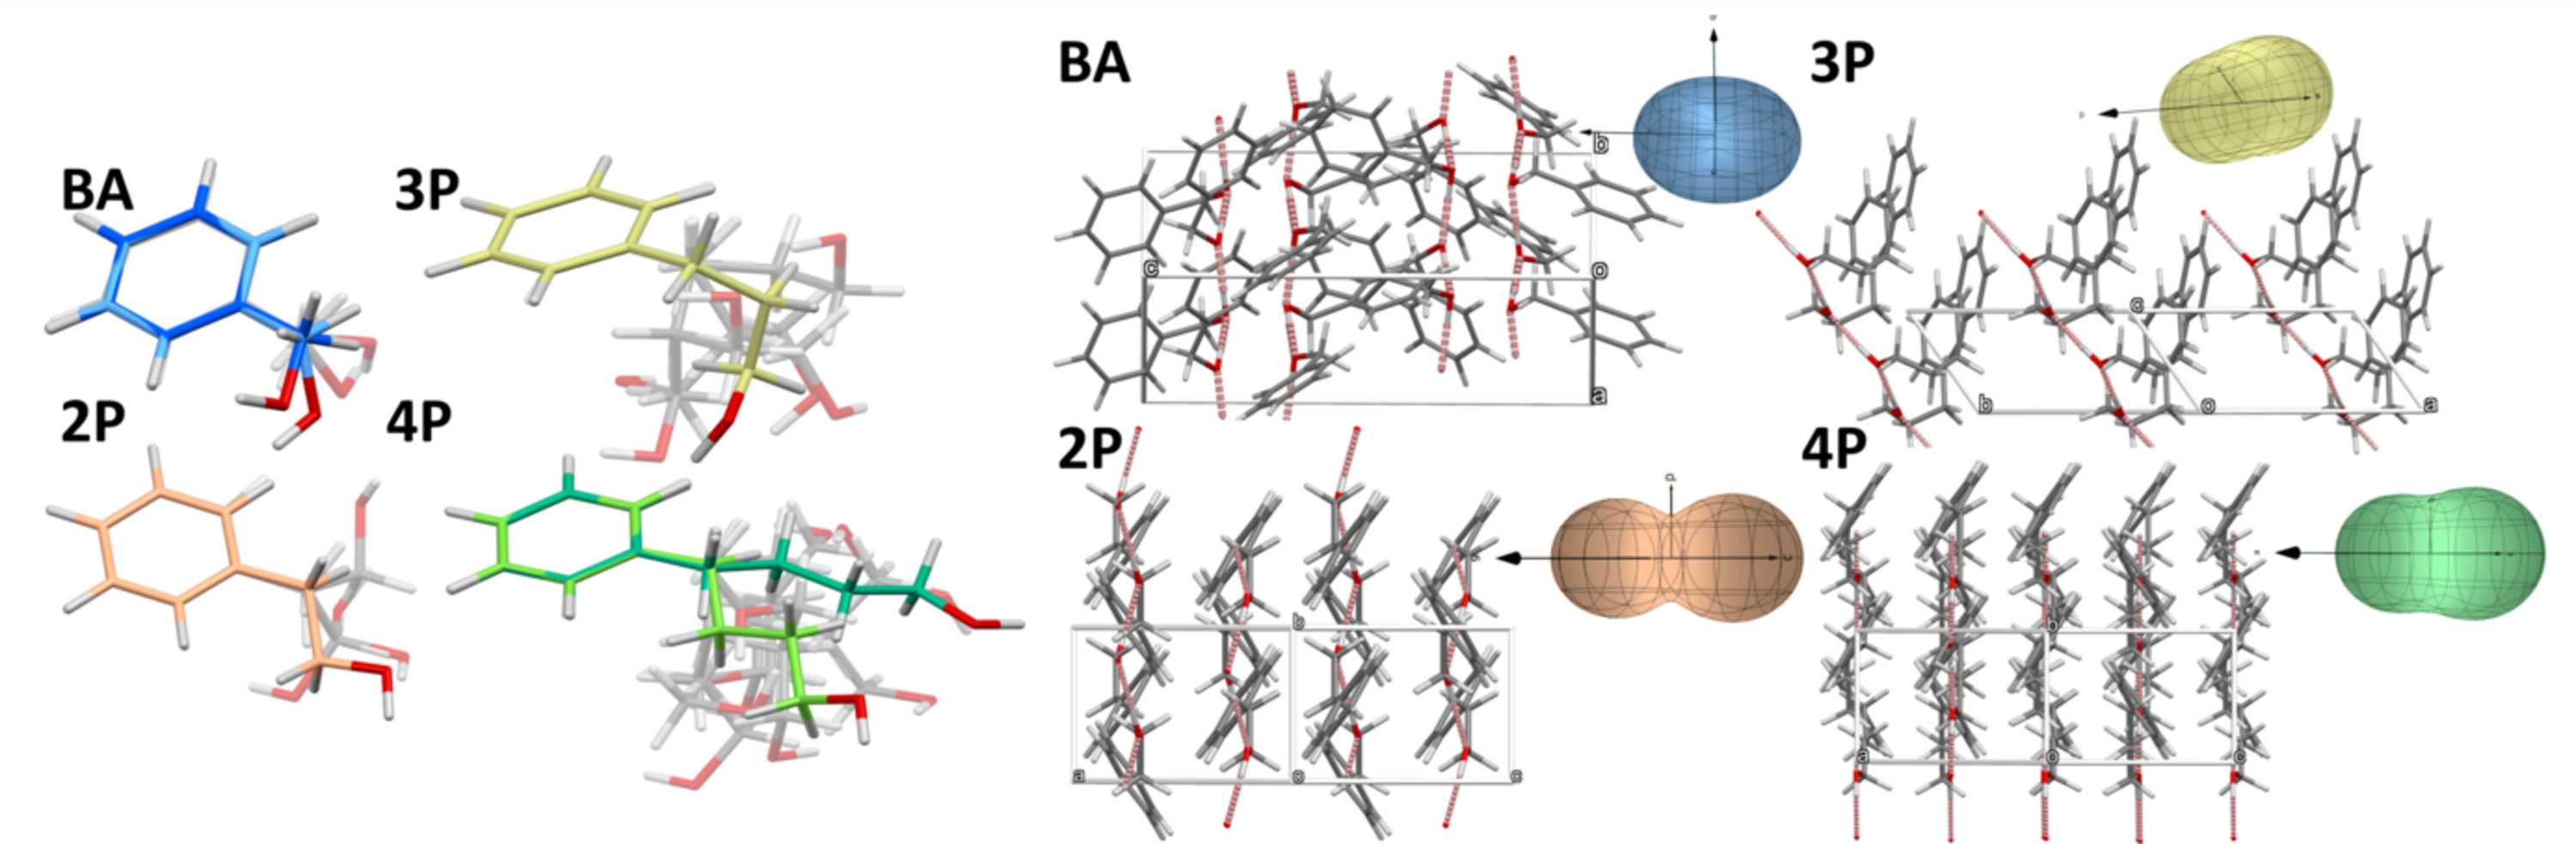
Figure 5
On the left, molecular conformations of the studied phenyl alcohols: DFT optimized at 0.8 GPa (colored molecules) and in the gas phase (gray molecules, see main text for references). On the right, the pressure compressibility of the optimized structures calculated for the studied phenyl alcohols over the pressure range 0.6–2.5 GPa. Axis directions match the presented crystal projections, and the units of compressibility are arbitrary, showing the relative compression in every axis direction. |
IUCrJ
ISSN: 2052-2525
CHEMISTRY | CRYSTENG
Open  access