


 menu
|
|
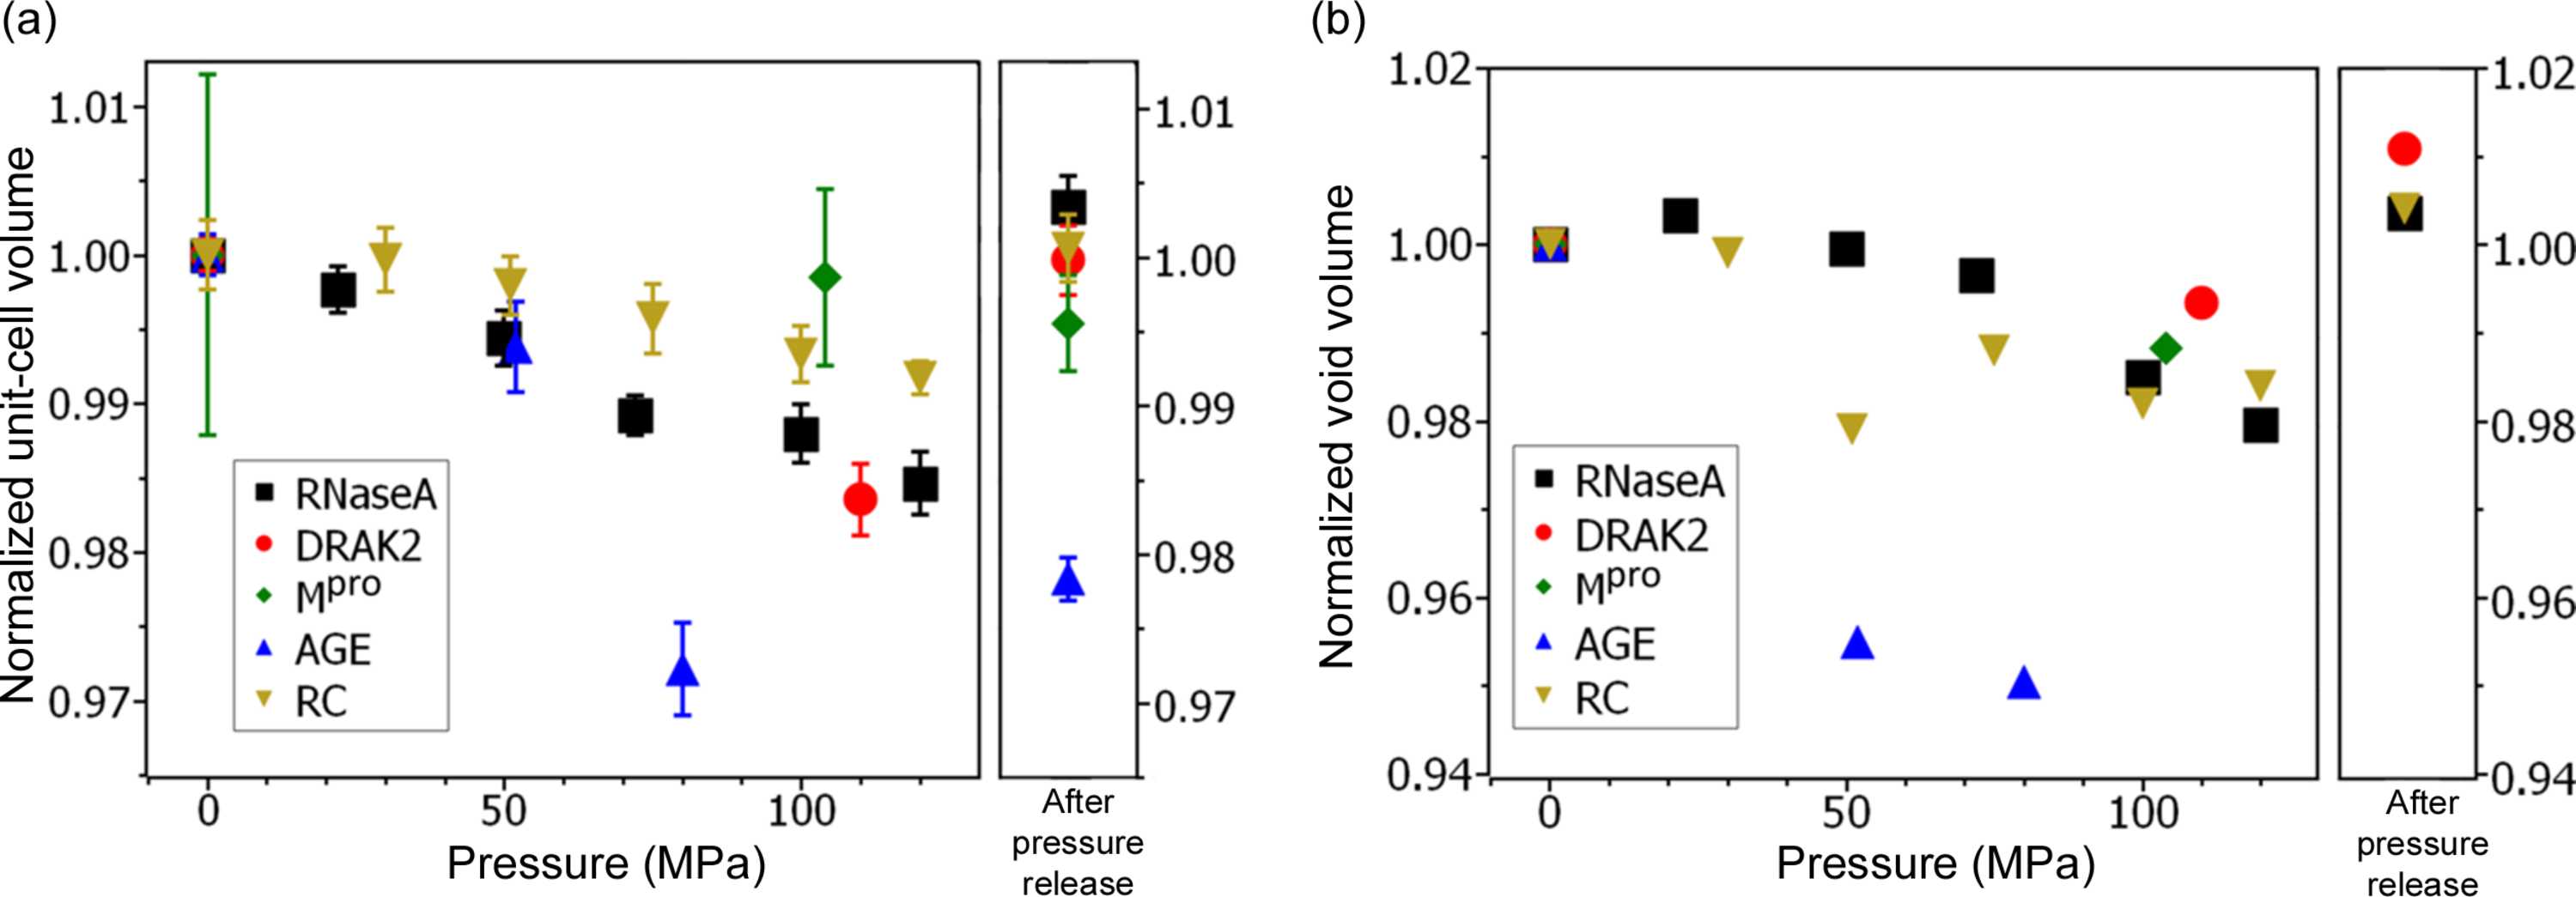
Figure 2
Changes in (a) unit-cell volumes and (b) void volumes of the five studied proteins at different pressures. All values are normalized to the corresponding values at atmospheric pressure. The depicted unit-cell volumes are the normalized average volumes calculated from 2–19 individual crystals, with the error bars displaying the normalized mean of the estimated standard deviation of the unit-cell volume. Void volumes were calculated from the refined structures using ProteinVolume 1.3 (Chen & Makhatadze, 2015  ). Due to the incompleteness of the data sets, there are no void volume values for Mpro and AGE after pressure release. |
IUCrJ
ISSN: 2052-2525
BIOLOGY | MEDICINE
Open  access