


 menu
|
|
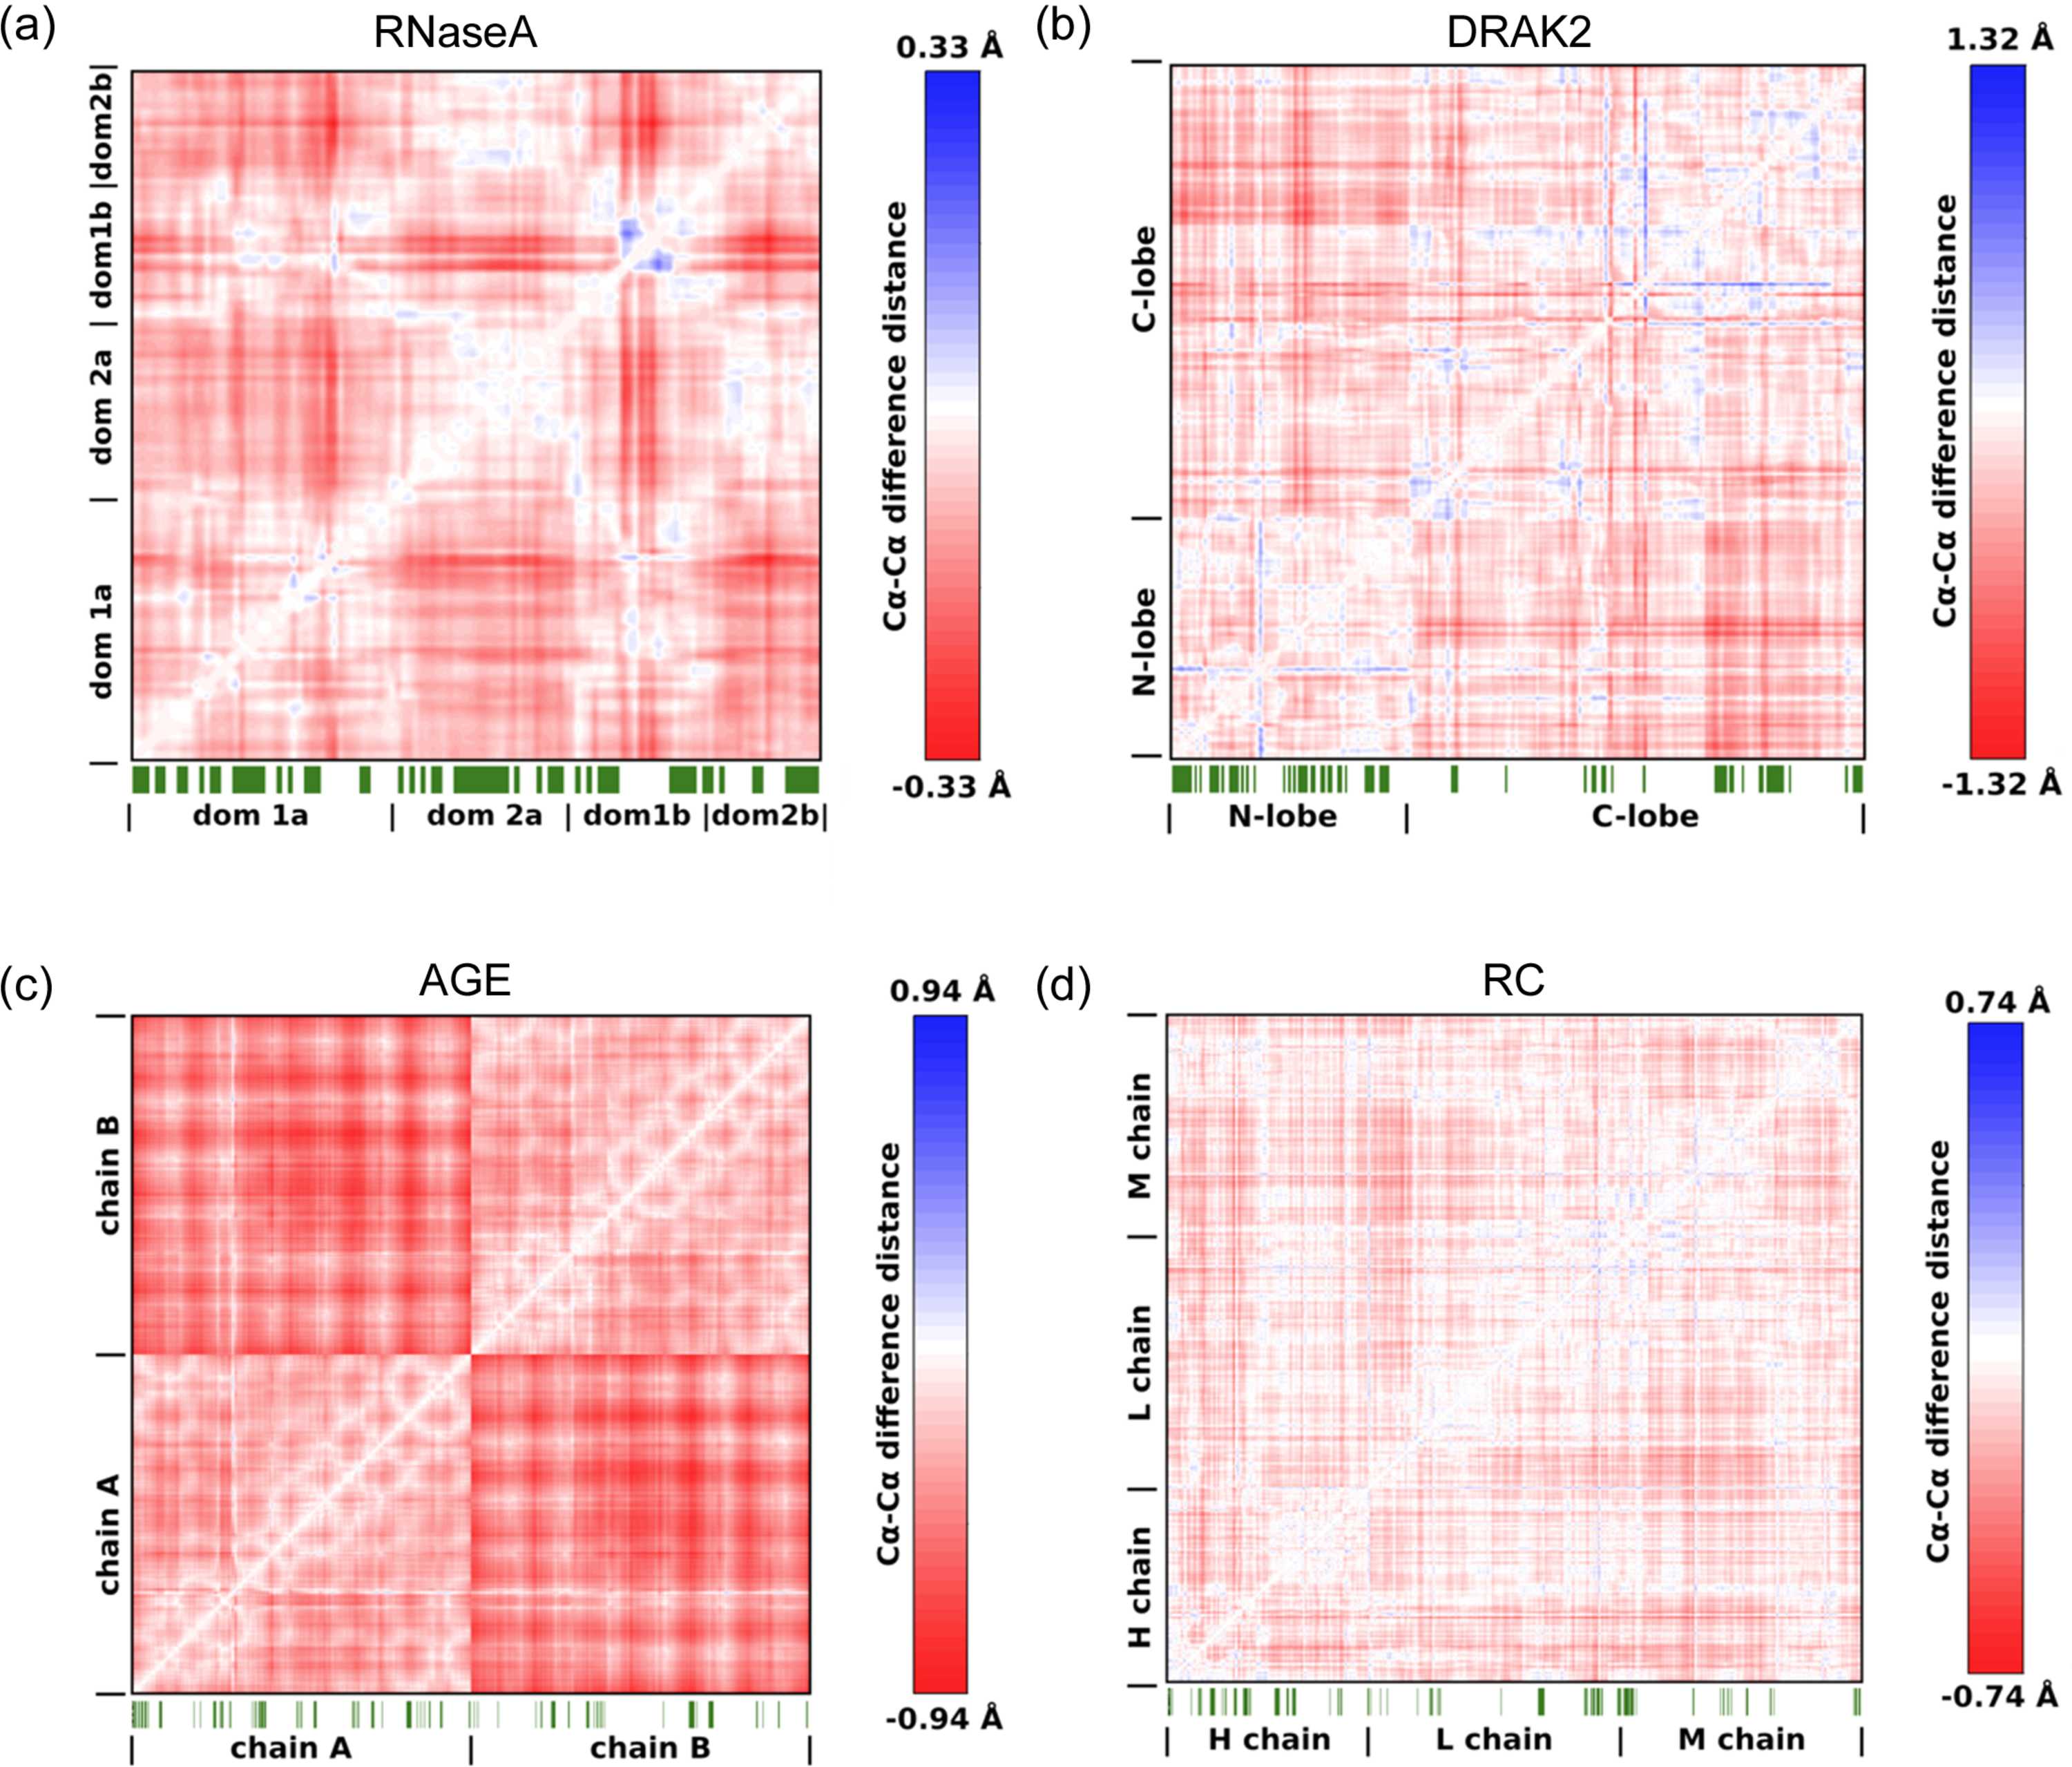
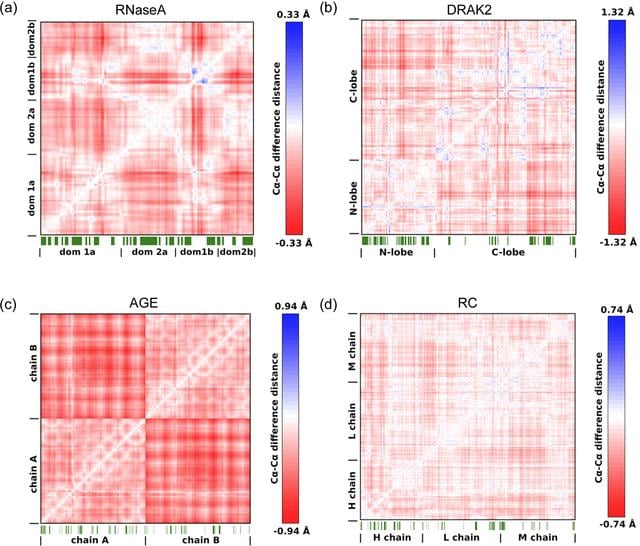
Figure 4
Cα—Cα DDMs showing the pressure-induced compression of the structures. Shown are (a) RNaseA at 120 MPa, (b) DRAK2 at 110 MPa, (c) AGE at 80 MPa and (d) the RC at 120 MPa compared with the corresponding structures at atmospheric pressure. Domains are labeled for a better overview. Negative values indicate compression. Maximum compression values differ between protein systems. Maximum values for each system were used for individual color scale definition for clarity. Crystal contacts of the HP structures are indicated as green line patterns below the matrices. Indicated are all interfacing crystallography-related residues according to PISA (Krissinel & Henrick, 2007  ). |
IUCrJ
ISSN: 2052-2525
BIOLOGY | MEDICINE
Open  access