


 menu
|
|
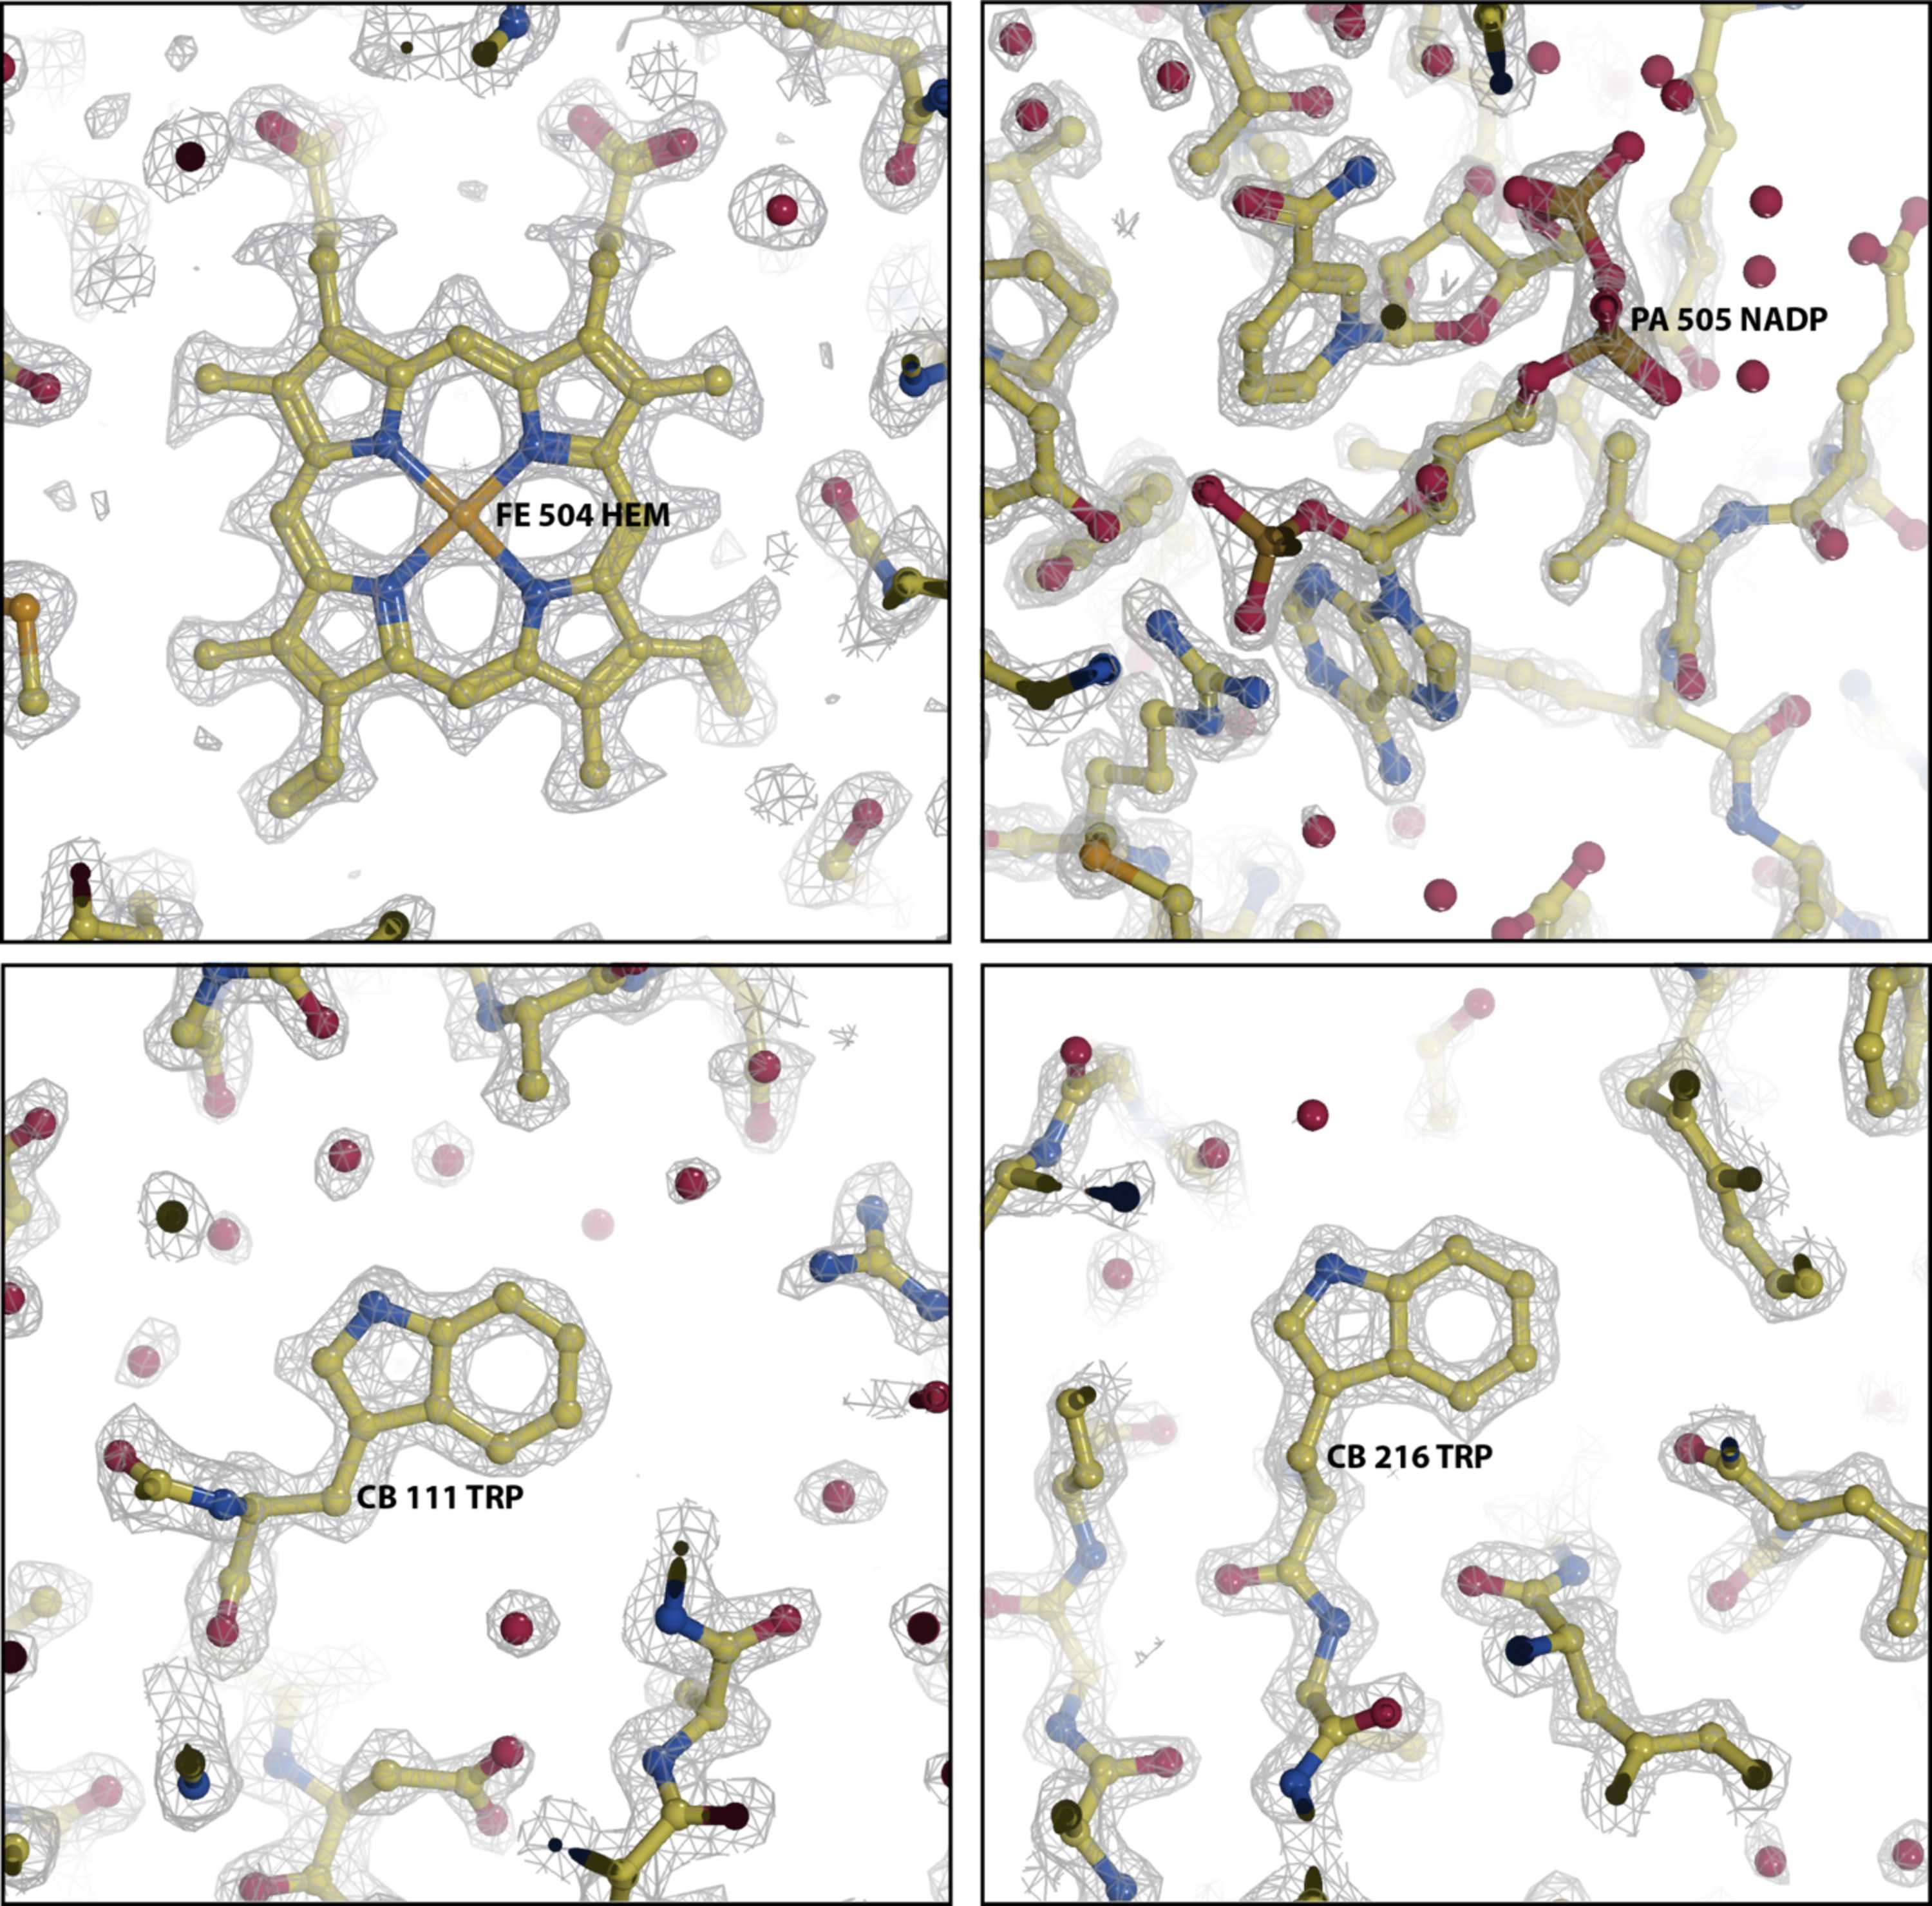
Figure 1
Potential distribution in cat_T cryoEM map with model superimposed: (a) haem, (b) NADPH, (c) Trp-111, (d) Trp-216. Hydrogen atoms were not explicitly refined and are not shown, yet these map regions all show clear evidence for hydrogen-atom densities. The contour threshold used was chosen to illustrate the densities for the haem, nicotinamide and tryptophan, so that the holes in each ring structure are clear, as expected at a resolution of 1.7 Å. A few of the water molecules in the model have lower occupancy and do not show their accompanying density at this contour threshold. |
IUCrJ
ISSN: 2052-2525
CRYO | EM
Open  access