


 menu
|
|
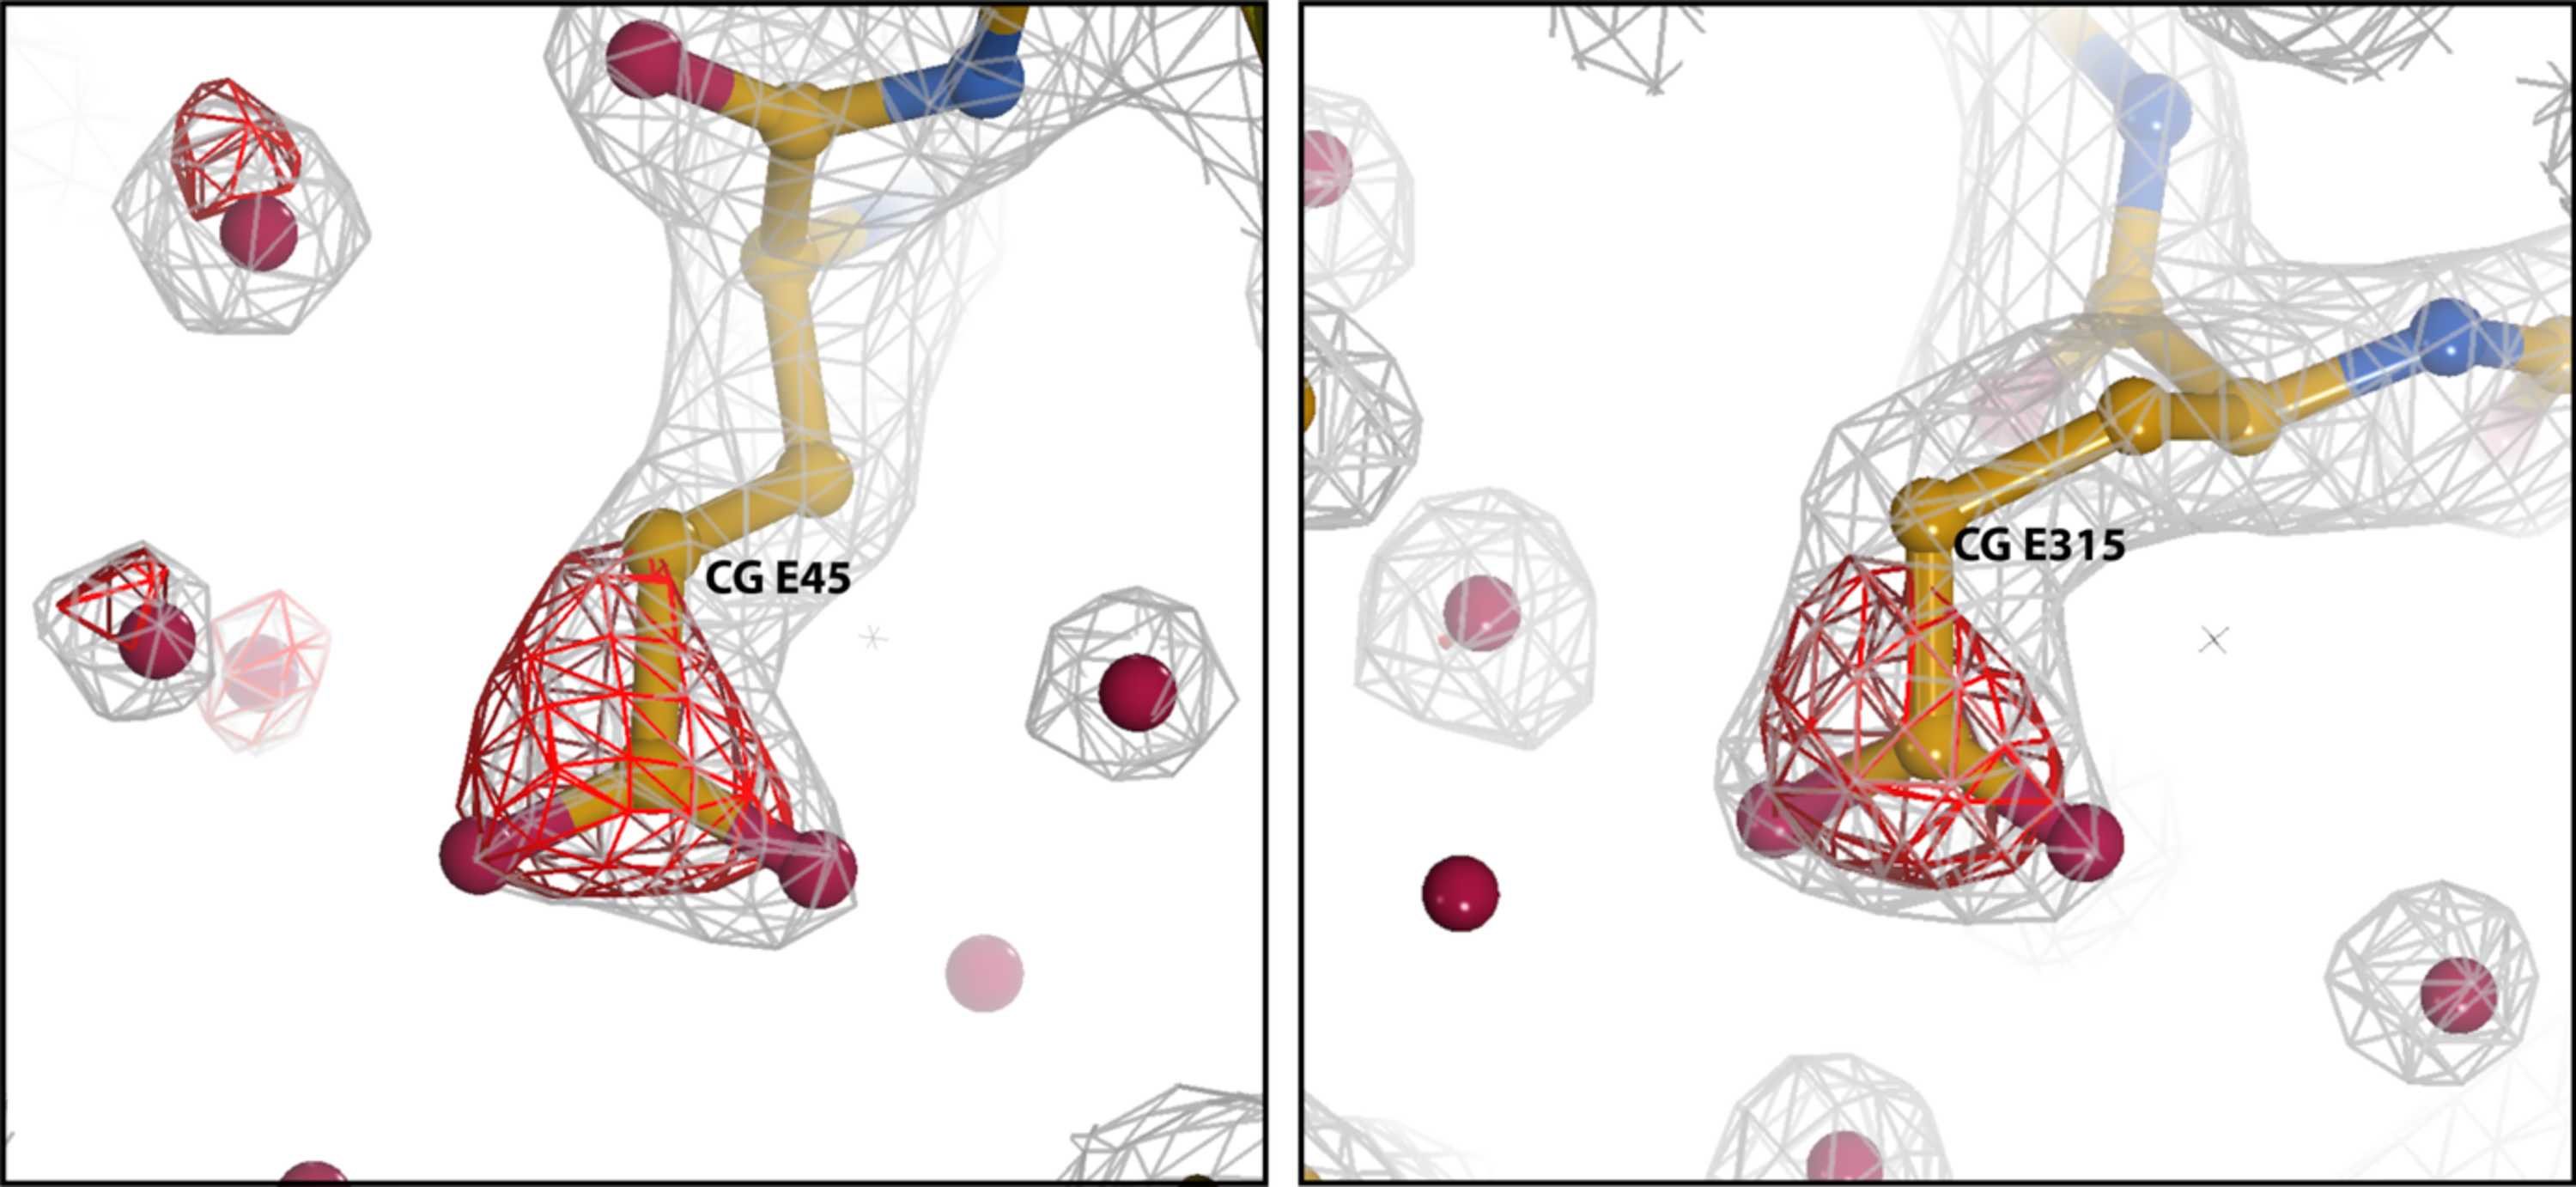
Figure 5
Examples of radiation damage to two glutamic acid side chains, E45 and E315, in cat_T. The grey mesh shows the full map. The red mesh shows the difference (loss of mass) between the 3D maps calculated between the first and second frames of the data collection movies, corresponding to a dose of 1.8 e− Å−2. |
IUCrJ
ISSN: 2052-2525
CRYO | EM
Open  access