


 menu
|
|
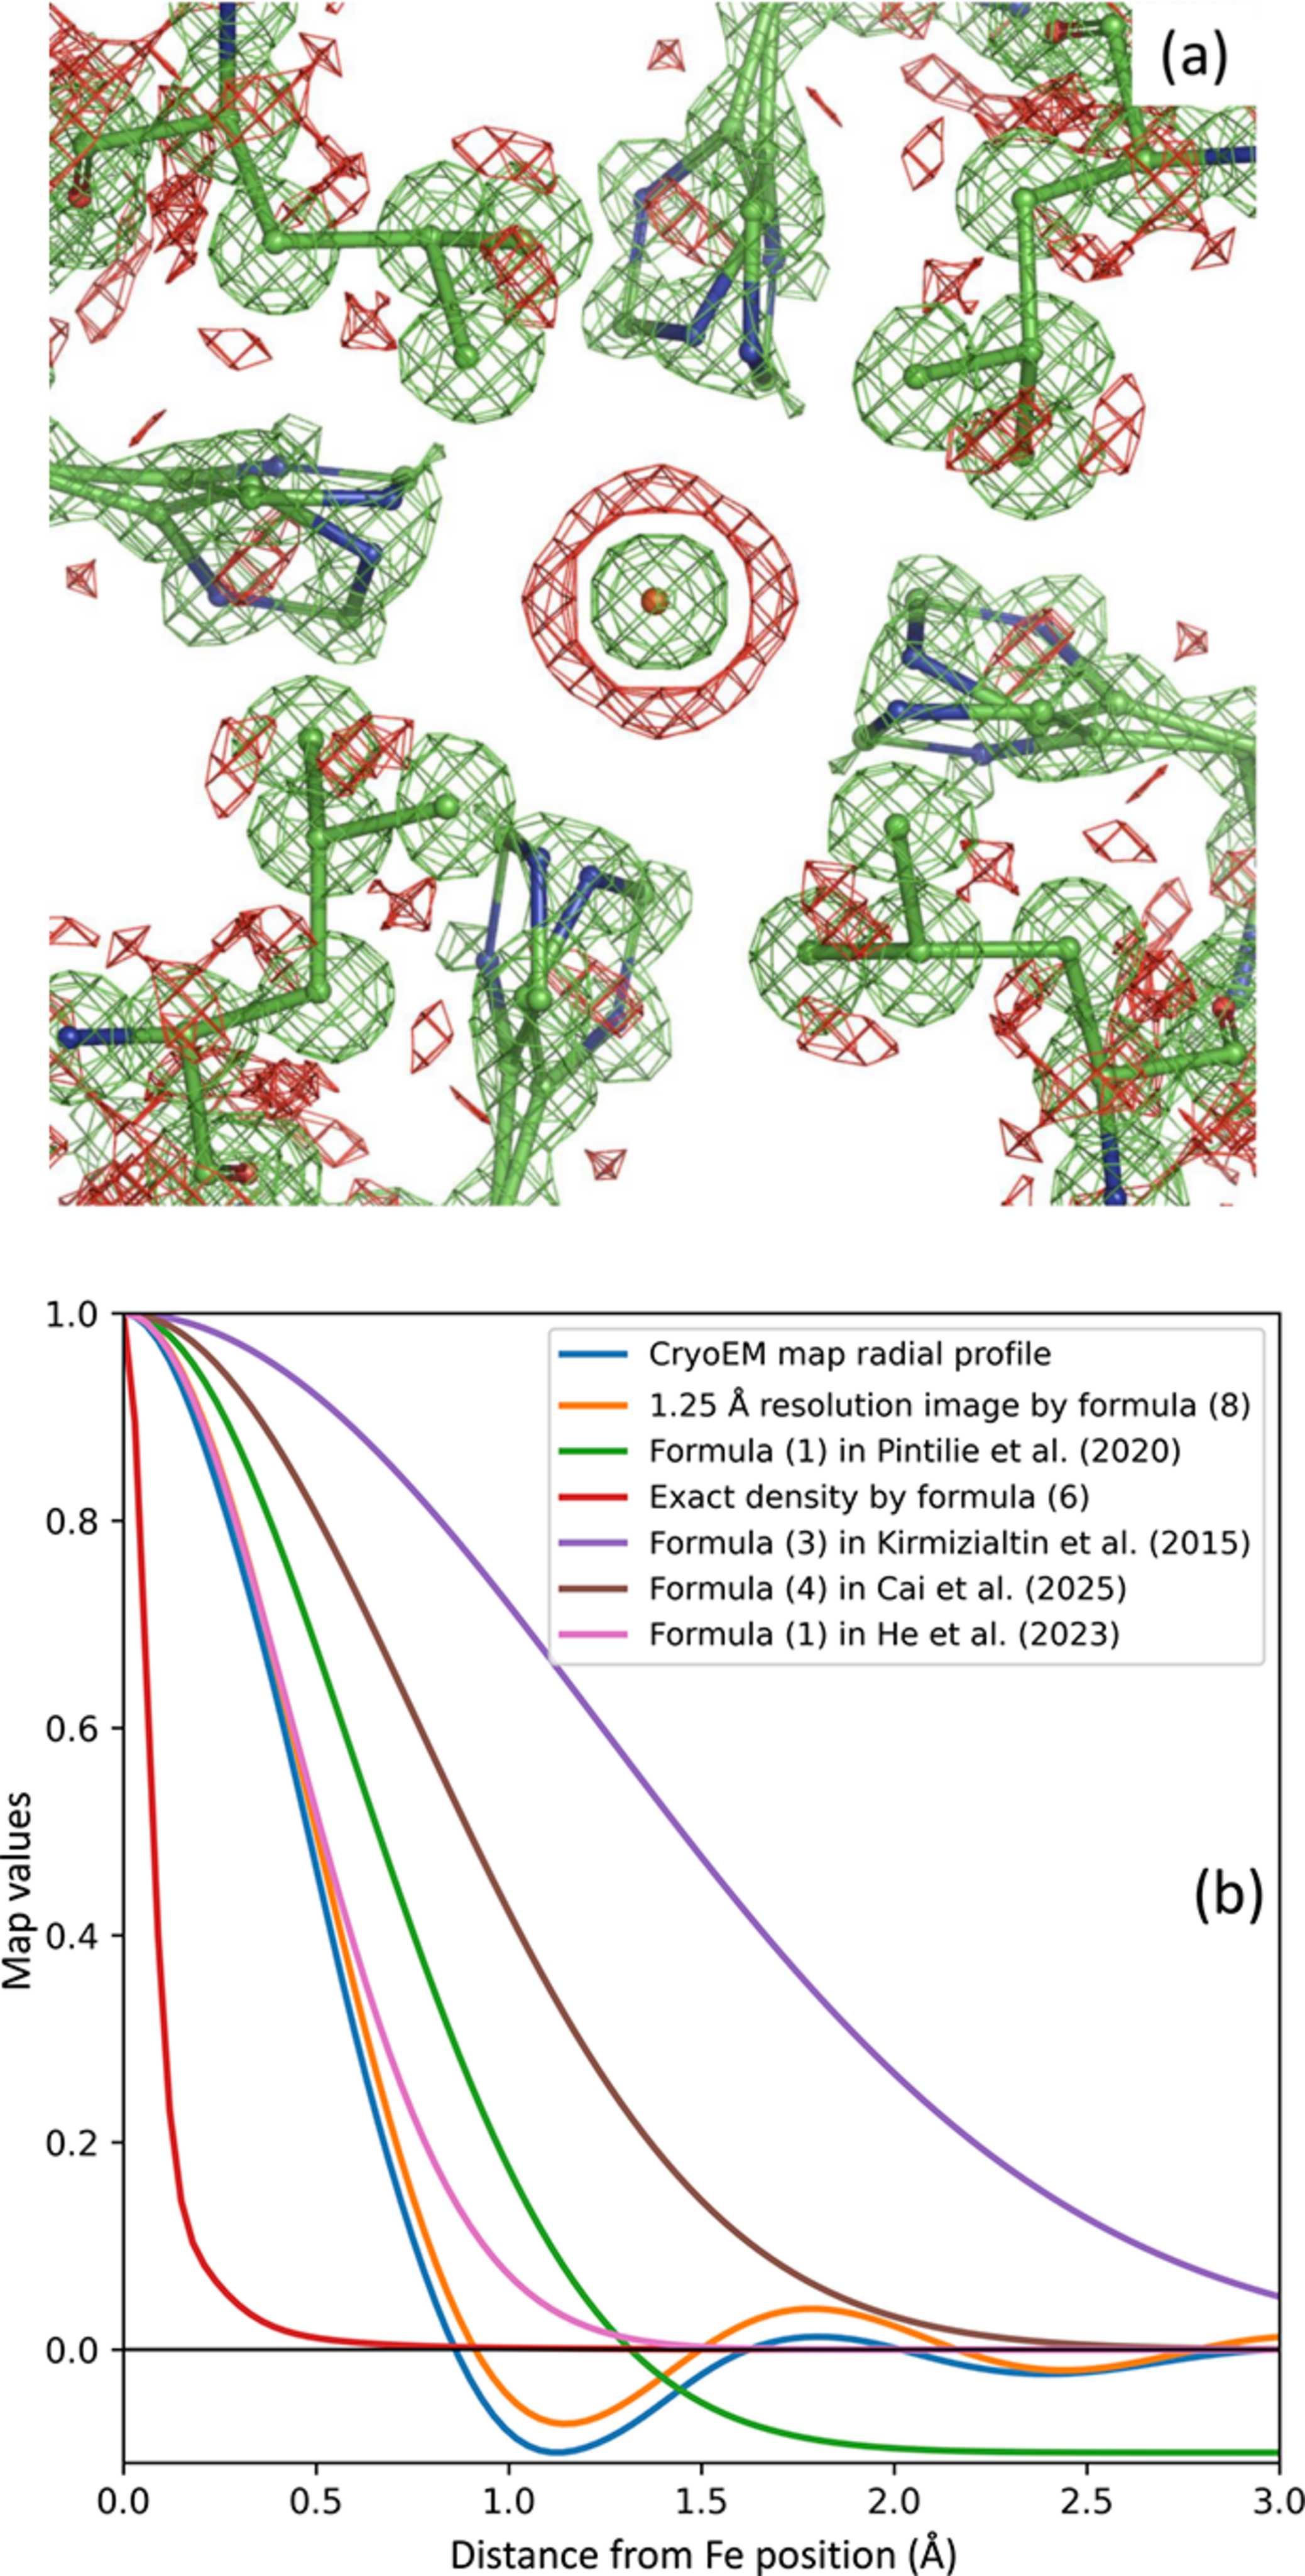
Figure 1
(a) CryoEM model of mouse heavy-chain apoferritin (PDB code: 8rqb), focusing on Fe 201 in chain A, and corresponding experimental map (EMDB code: 19436) contoured at ±1.5 units. (b) Radial components of the experimental cryoEM map around Fe (blue curve), exact density (red curve) and its finite-resolution image computed using (8)  (orange curve), and of several maps calculated for an isolated Fe atom. All maps normalized by their values at the origin (maximum value). See the main text for details. |
IUCrJ
ISSN: 2052-2525
CRYO | EM
Open  access