


 menu
|
|
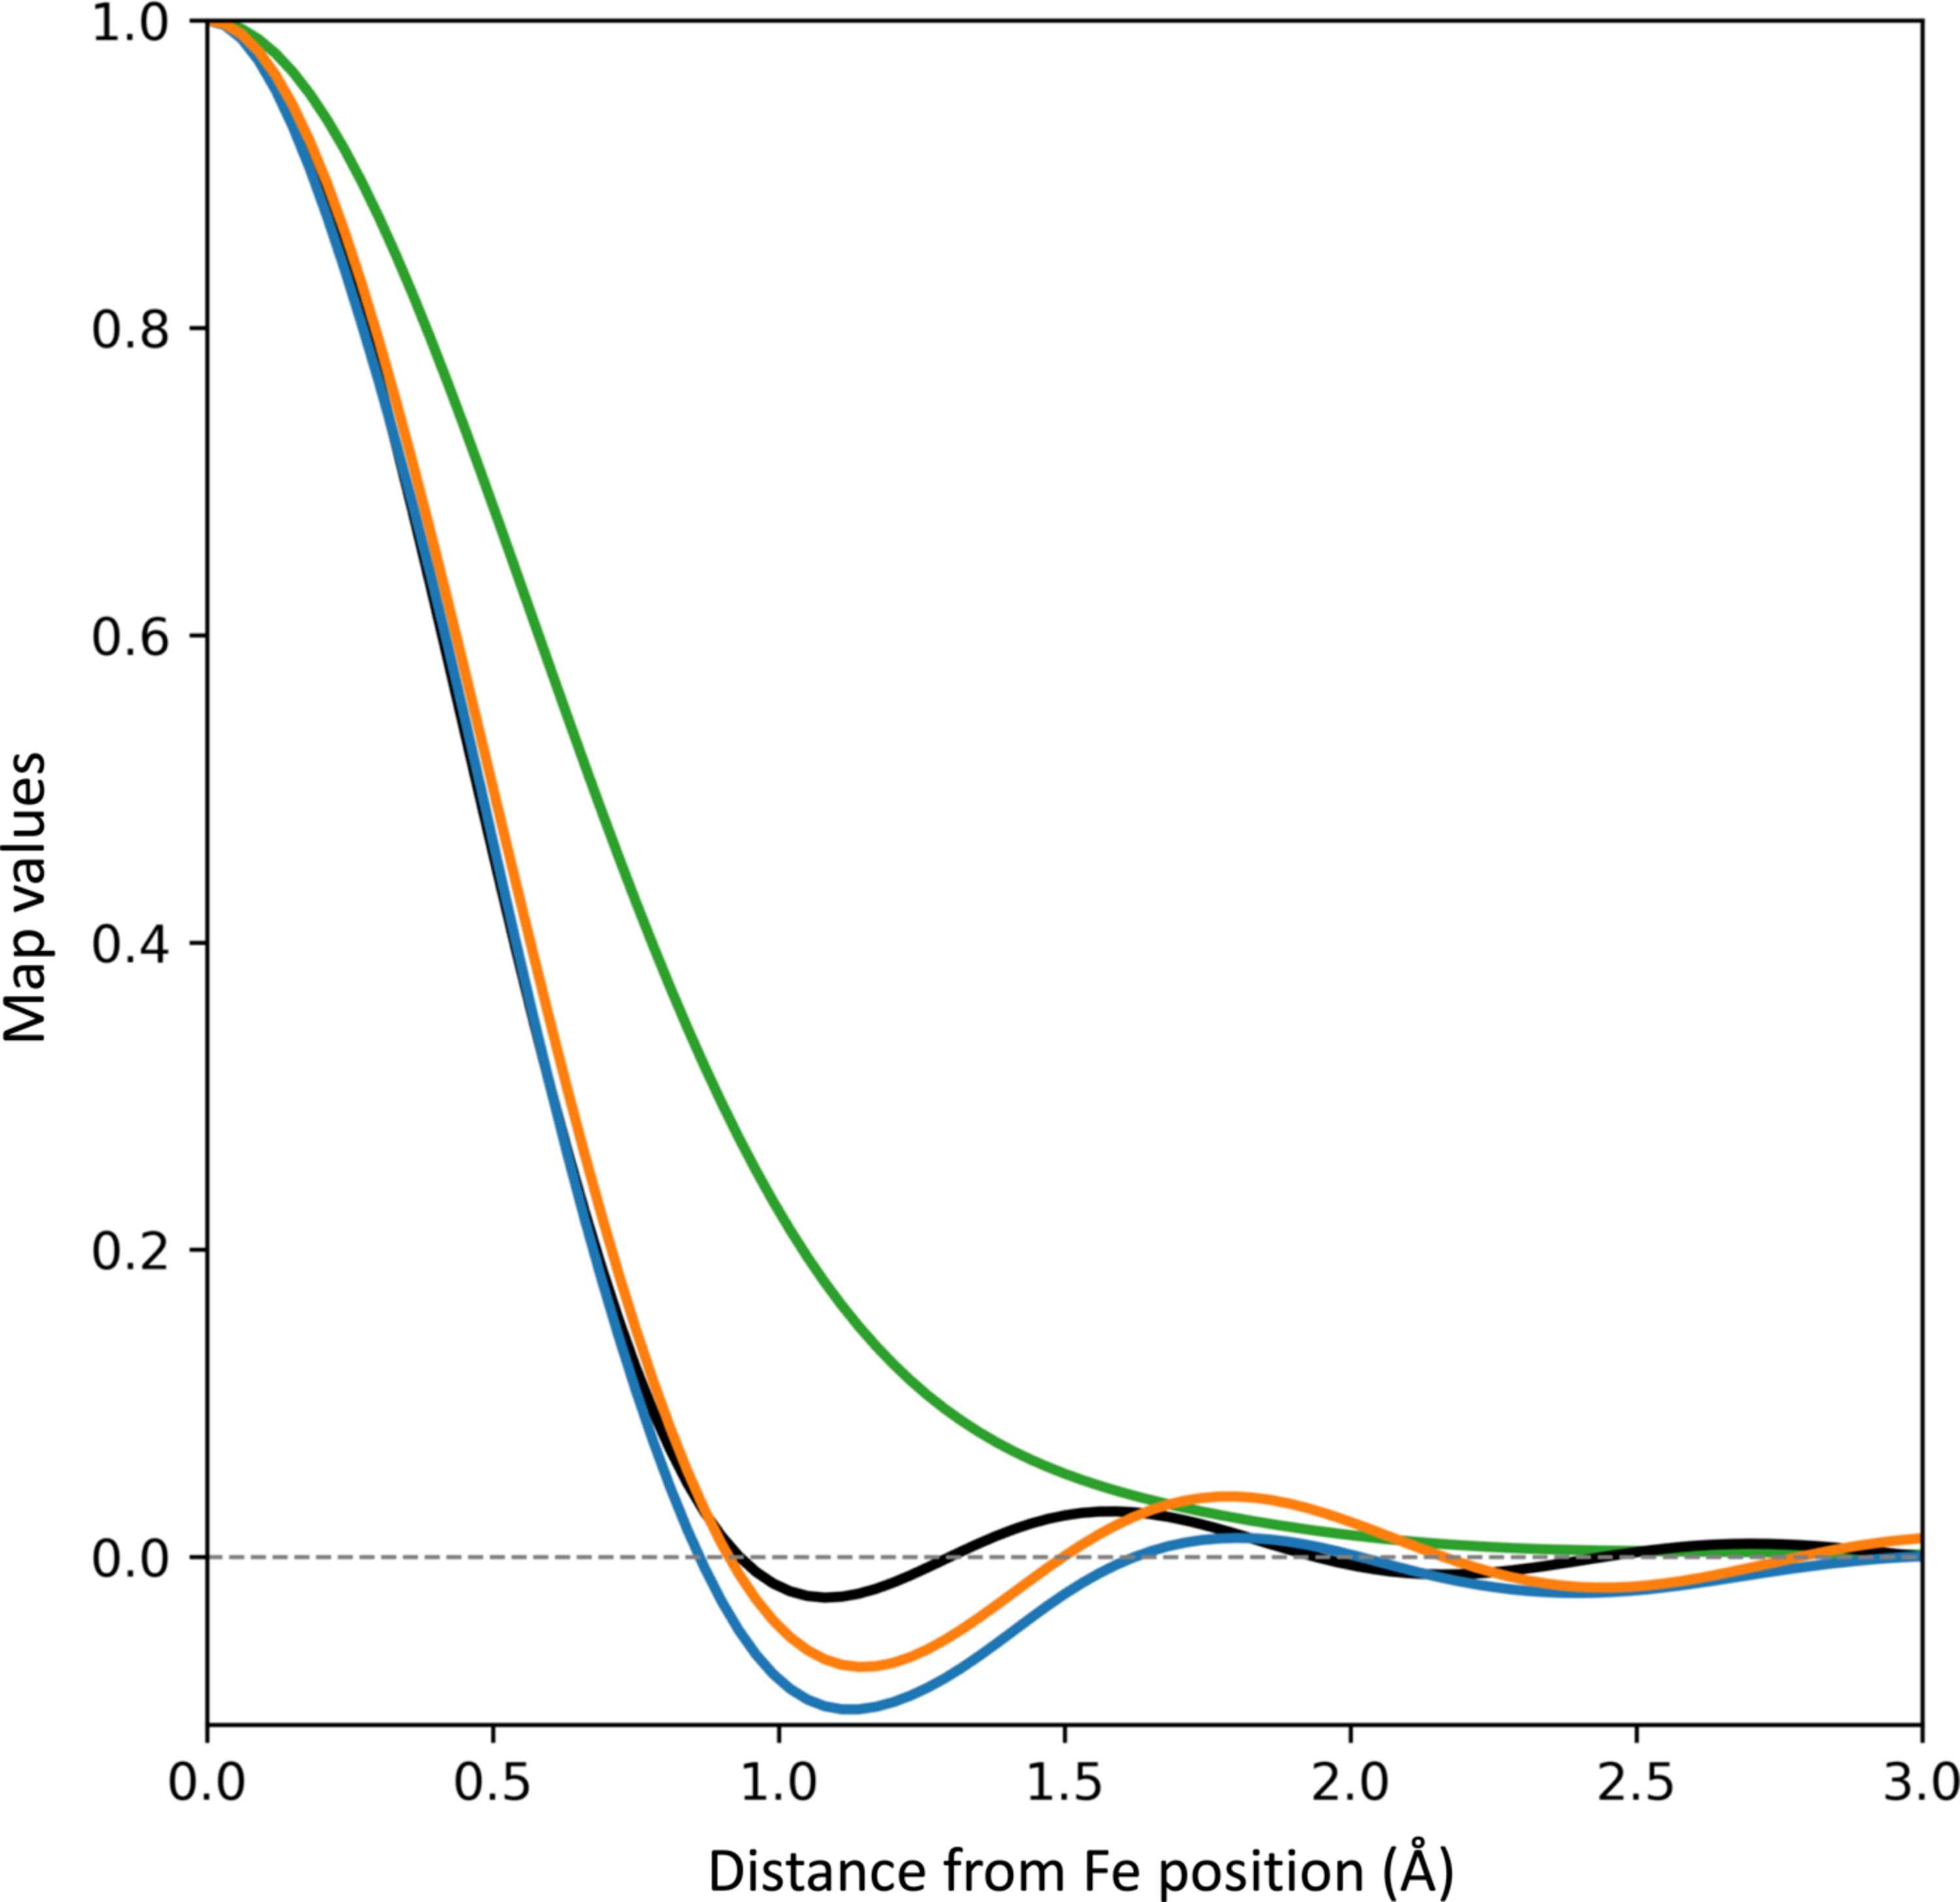
Figure 10
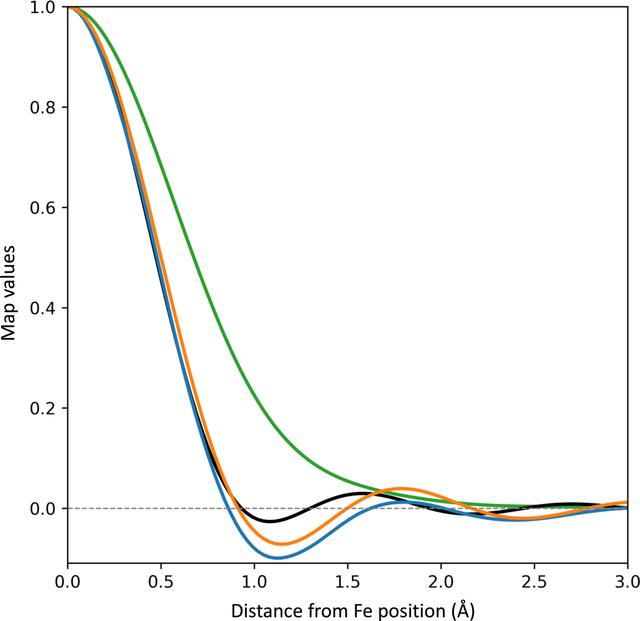
CryoEM data considered in Fig. 1  , and still focusing on Fe 201 in chain A. Blue: spherically averaged cryoEM map profile originating from iron (0.0 Å) out to 3 Å. Orange: Fourier image of isolated Fe at 1.25 Å resolution with B = −6 Å2. Green: Fourier image of isolated Fe at 1.09 Å resolution with B = 17.22 Å2. Black: Fourier image of isolated Fe at 1.09 Å resolution with B = 0 Å2. All maps normalized by their values at the origin (maximum value). |
IUCrJ
ISSN: 2052-2525
CRYO | EM
Open  access