


 menu
|
|
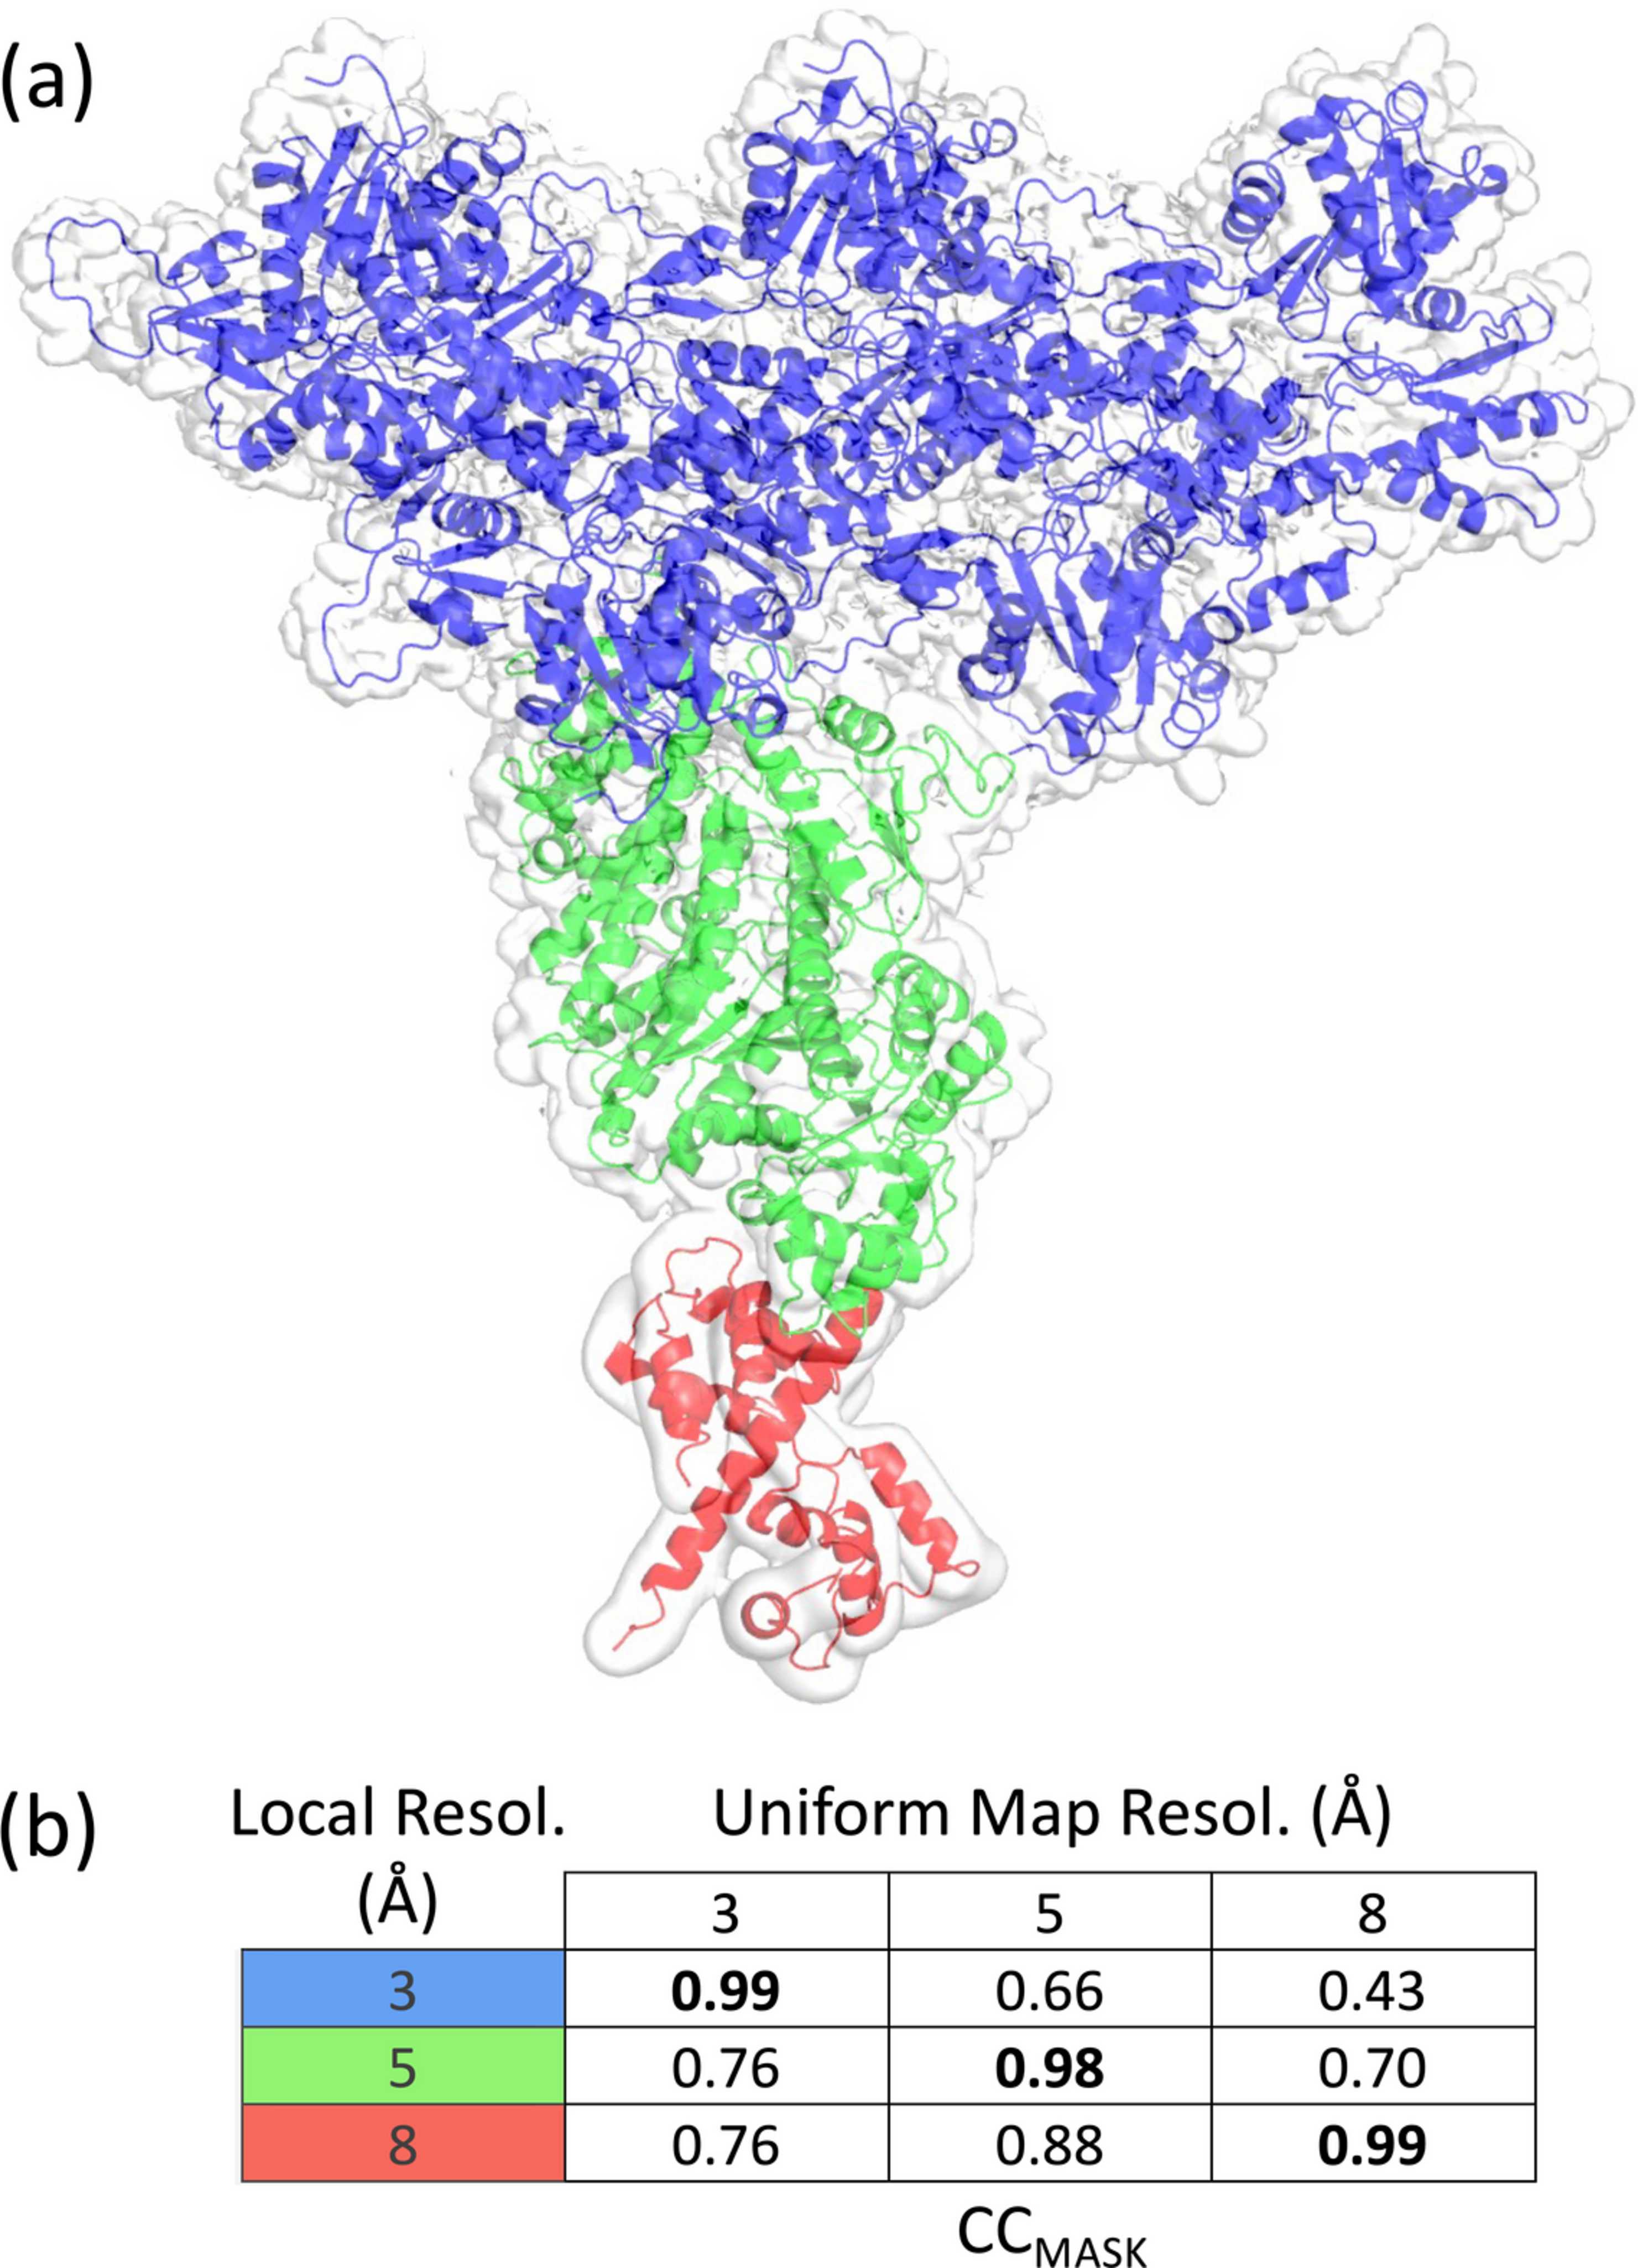
Figure 11
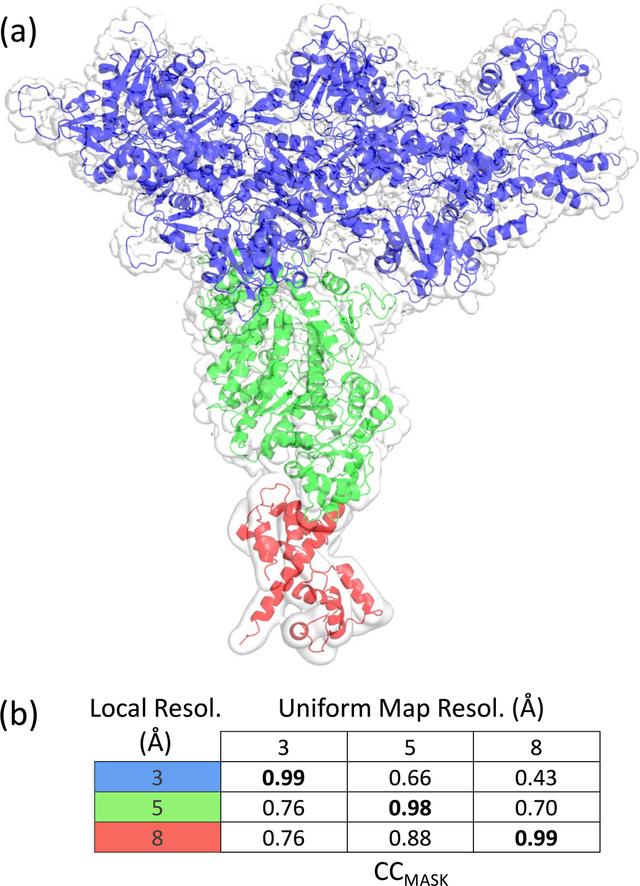
(a) Actin-bound myosin model in a VRM map computed using the local resolution assigned per atom for three regions: 3 Å (blue), 5 Å (green) and 8 Å (red) (all atoms within each region share the same resolution of 3, 5 and 8 Å, respectively). (b) CCmask correlation for combinations of local resolution in the control map and the uniform resolution used for the model-calculated map. Note the remarkably low value of CCmask = 0.66 for the region of the control map with 3 Å local resolution when the uniform resolution was assumed to be 5 Å. Values in bold on the diagonal indicate overlap of local and uniform resolutions and are expected to be nearly 1.0 by the design of the test. |
IUCrJ
ISSN: 2052-2525
CRYO | EM
Open  access